Furuno#
[1]:
import xarray as xr
import xradar as xd
from open_radar_data import DATASETS
Download#
Fetching Furuno radar data file from open-radar-data repository.
[2]:
filename_scnx = DATASETS.fetch("2006_20220324_000000_000.scnx.gz")
filename_scn = DATASETS.fetch("0080_20210730_160000_01_02.scn.gz")
Downloading file '2006_20220324_000000_000.scnx.gz' from 'https://github.com/openradar/open-radar-data/raw/main/data/2006_20220324_000000_000.scnx.gz' to '/home/docs/.cache/open-radar-data'.
Downloading file '0080_20210730_160000_01_02.scn.gz' from 'https://github.com/openradar/open-radar-data/raw/main/data/0080_20210730_160000_01_02.scn.gz' to '/home/docs/.cache/open-radar-data'.
xr.open_dataset#
Making use of the xarray furuno backend.
scn format#
[3]:
ds = xr.open_dataset(filename_scn, engine="furuno")
display(ds)
<xarray.Dataset> Size: 28MB
Dimensions:            (azimuth: 1376, range: 602)
Coordinates:
    elevation          (azimuth) float32 6kB ...
  * range              (range) float32 2kB 25.0 75.0 ... 3.002e+04 3.008e+04
    time               (azimuth) datetime64[ns] 11kB ...
    longitude          float64 8B ...
    latitude           float64 8B ...
    altitude           float64 8B ...
  * azimuth            (azimuth) float32 6kB 0.21 0.47 0.74 ... 359.7 359.9
Data variables: (12/14)
    RATE               (azimuth, range) float32 3MB ...
    DBZH               (azimuth, range) float32 3MB ...
    VRADH              (azimuth, range) float32 3MB ...
    ZDR                (azimuth, range) float32 3MB ...
    KDP                (azimuth, range) float32 3MB ...
    PHIDP              (azimuth, range) float32 3MB ...
    ...                 ...
    QUAL               (azimuth, range) uint16 2MB ...
    sweep_mode         <U20 80B ...
    sweep_number       int64 8B ...
    prt_mode           <U7 28B ...
    follow_mode        <U7 28B ...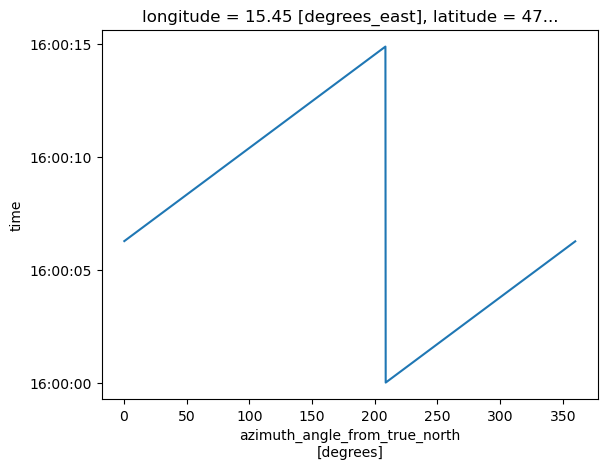
sweep_fixed_angle float64 8B ...Plot Time vs. Azimuth#
[4]:
ds.azimuth.plot(y="time")
[4]:
[<matplotlib.lines.Line2D at 0x7fbd56004650>]
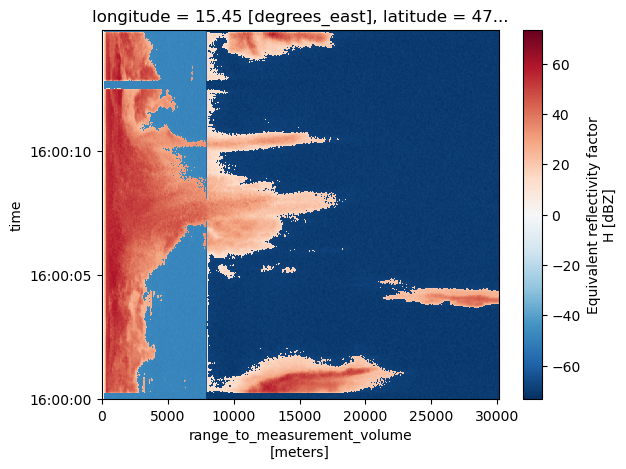
Plot Range vs. Time#
We need to sort by time and specify the y-coordinate.
[5]:
ds.DBZH.sortby("time").plot(y="time")
[5]:
<matplotlib.collections.QuadMesh at 0x7fbd5611b150>
Plot Range vs. Azimuth#
[6]:
ds.DBZH.sortby("azimuth").plot(y="azimuth")
[6]:
<matplotlib.collections.QuadMesh at 0x7fbd4df46f10>

scnx format#
[7]:
ds = xr.open_dataset(filename_scnx, engine="furuno")
display(ds)
<xarray.Dataset> Size: 23MB
Dimensions:            (azimuth: 722, range: 936)
Coordinates:
    elevation          (azimuth) float32 3kB ...
  * range              (range) float32 4kB 37.5 112.5 ... 7.009e+04 7.016e+04
    time               (azimuth) datetime64[ns] 6kB ...
    longitude          float64 8B ...
    latitude           float64 8B ...
    altitude           float64 8B ...
  * azimuth            (azimuth) float32 3kB 0.19 0.68 1.16 ... 359.2 359.7
Data variables: (12/14)
    RATE               (azimuth, range) float32 3MB ...
    DBZH               (azimuth, range) float32 3MB ...
    VRADH              (azimuth, range) float32 3MB ...
    ZDR                (azimuth, range) float32 3MB ...
    KDP                (azimuth, range) float32 3MB ...
    PHIDP              (azimuth, range) float32 3MB ...
    ...                 ...
    QUAL               (azimuth, range) uint16 1MB ...
    sweep_mode         <U20 80B ...
    sweep_number       int64 8B ...
    prt_mode           <U7 28B ...
    follow_mode        <U7 28B ...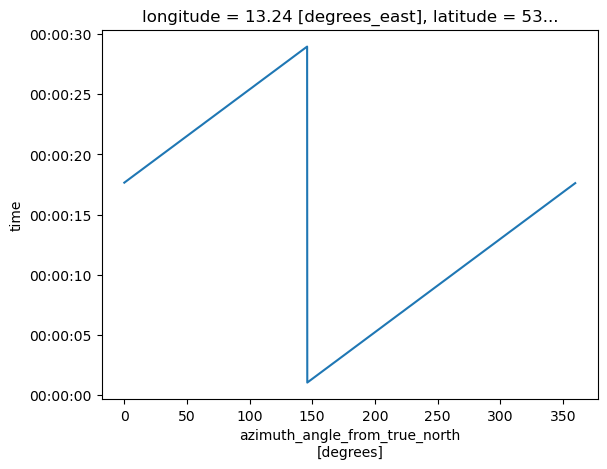
sweep_fixed_angle float64 8B ...Plot Time vs. Azimuth#
[8]:
ds.azimuth.plot(y="time")
[8]:
[<matplotlib.lines.Line2D at 0x7fbd4c5bf750>]
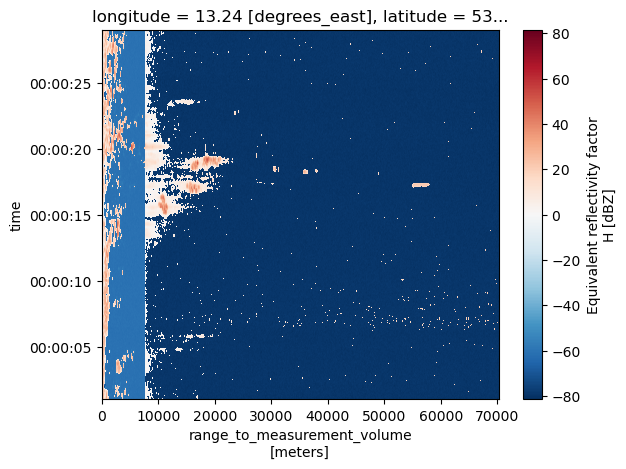
Plot Range vs. Time#
We need to sort by time and specify the y-coordinate.
[9]:
ds.DBZH.sortby("time").plot(y="time")
[9]:
<matplotlib.collections.QuadMesh at 0x7fbd4c654b50>
Plot Range vs. Azimuth#
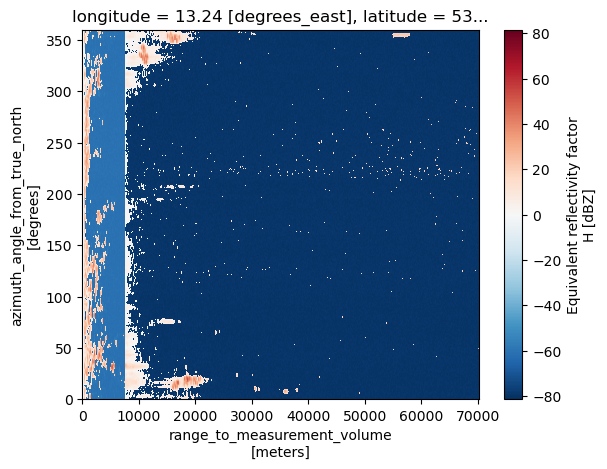
[10]:
ds.DBZH.sortby("azimuth").plot(y="azimuth")
[10]:
<matplotlib.collections.QuadMesh at 0x7fbd56fded90>
open_furuno_datatree#
Furuno scn/scnx files consist only of one sweep. But we might load and combine several sweeps into one DataTree.
[11]:
dtree = xd.io.open_furuno_datatree(filename_scn)
display(dtree)
<xarray.DatasetView> Size: 232B
Dimensions:              ()
Data variables:
    volume_number        int64 8B 0
    platform_type        <U5 20B 'fixed'
    instrument_type      <U5 20B 'radar'
    time_coverage_start  <U20 80B '2021-07-30T16:00:00Z'
    time_coverage_end    <U20 80B '2021-07-30T16:00:14Z'
    longitude            float64 8B 15.45
    altitude             float64 8B 407.9
    latitude             float64 8B 47.08
Attributes:
    Conventions:      None
    instrument_name:  None
    version:          None
    title:            None
    institution:      None
    references:       None
    source:           None
    history:          None
comment: im/exported using xradarPlot Sweep Range vs. Time#
[12]:
dtree["sweep_0"].ds.DBZH.plot()
[12]:
<matplotlib.collections.QuadMesh at 0x7fbd56f0a1d0>
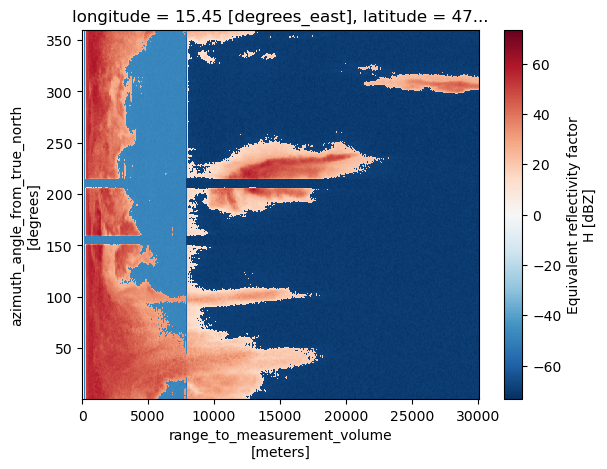
Plot Sweep Range vs. Azimuth#
[13]:
dtree["sweep_0"].ds.DBZH.sortby("azimuth").plot(y="azimuth")
[13]:
<matplotlib.collections.QuadMesh at 0x7fbd56ddb990>
