GAMIC#
import xarray as xr
from open_radar_data import DATASETS

import xradar as xd
Download#
Fetching GAMIC radar data file from open-radar-data repository.
filename = DATASETS.fetch("DWD-Vol-2_99999_20180601054047_00.h5")
Downloading file 'DWD-Vol-2_99999_20180601054047_00.h5' from 'https://github.com/openradar/open-radar-data/raw/main/data/DWD-Vol-2_99999_20180601054047_00.h5' to '/home/docs/.cache/open-radar-data'.
xr.open_dataset#
Making use of the xarray gamic backend. We also need to provide the group. Note, that we are using CfRadial2 group access pattern.
ds = xr.open_dataset(filename, group="sweep_9", engine="gamic")
display(ds)
<xarray.Dataset> Size: 17MB
Dimensions:            (azimuth: 360, range: 1000)
Coordinates:
  * azimuth            (azimuth) float64 3kB 0.5109 1.519 2.519 ... 358.5 359.5
    elevation          (azimuth) float64 3kB ...
    time               (azimuth) datetime64[ns] 3kB ...
  * range              (range) float32 4kB 75.0 225.0 ... 1.498e+05 1.499e+05
    longitude          float64 8B ...
    latitude           float64 8B ...
    altitude           float64 8B ...
Data variables: (12/18)
    DBZH               (azimuth, range) float32 1MB ...
    DBZV               (azimuth, range) float32 1MB ...
    KDP                (azimuth, range) float32 1MB ...
    RHOHV              (azimuth, range) float32 1MB ...
    DBTH               (azimuth, range) float32 1MB ...
    DBTV               (azimuth, range) float32 1MB ...
    ...                 ...
    sweep_mode         <U20 80B ...
    sweep_number       int64 8B ...
    prt_mode           <U7 28B ...
    follow_mode        <U7 28B ...
    sweep_fixed_angle  float64 8B ...
    nyquist_velocity   float64 8B ...
Attributes:
    source:         gamic
    ant_gain_h:     43
    ant_gain_v:     43
    noise_power_h:  -3.40133
    noise_power_v:  -3.13518
    rx_loss_h:      3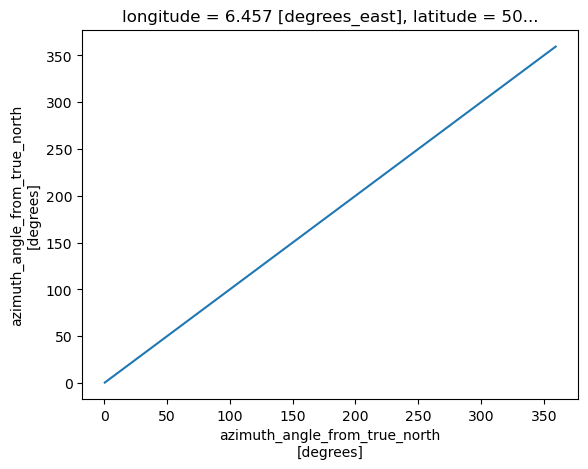
rx_loss_v: 3Plot Time vs. Azimuth#
ds.azimuth.plot()
[<matplotlib.lines.Line2D at 0x74cc29cc2c10>]
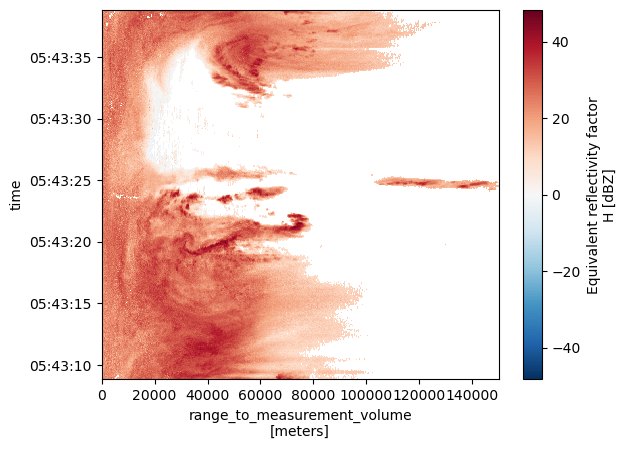
Plot Range vs. Time#
ds.DBZH.plot()
<matplotlib.collections.QuadMesh at 0x74cc29b867b0>
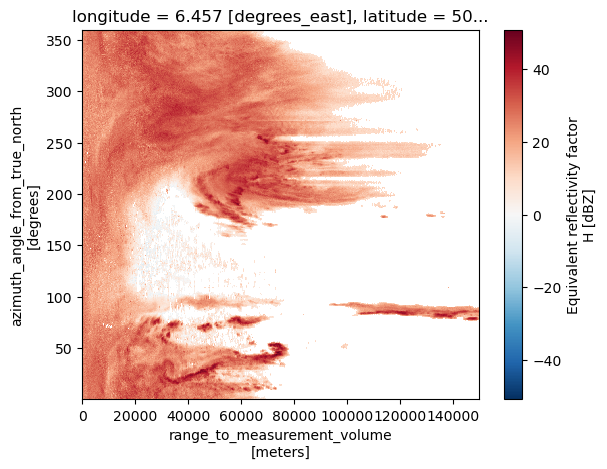
Plot Range vs. Azimuth#
We need to sort by azimuth and specify the y-coordinate.
ds.DBZH.sortby("azimuth").plot(y="azimuth")
<matplotlib.collections.QuadMesh at 0x74cc2186e990>
backend_kwargs#
Beside first_dim there are several additional backend_kwargs for the odim backend, which handle different aspects of angle alignment. This comes into play, when azimuth and/or elevation arrays are not evenly spacend and other issues.
help(xd.io.GamicBackendEntrypoint)
Help on class GamicBackendEntrypoint in module xradar.io.backends.gamic:

class GamicBackendEntrypoint(xarray.backends.common.BackendEntrypoint)
 |  Xarray BackendEntrypoint for GAMIC data.
 |
 |  Keyword Arguments
 |  -----------------
 |  first_dim : str
 |      Can be ``time`` or ``auto`` first dimension. If set to ``auto``,
 |      first dimension will be either ``azimuth`` or ``elevation`` depending on
 |      type of sweep. Defaults to ``auto``.
 |  reindex_angle : bool or dict
 |      Defaults to False, no reindexing. Given dict should contain the kwargs to
 |      reindex_angle. Only invoked if `decode_coord=True`.
 |  fix_second_angle : bool
 |      For PPI only. If True, fixes erroneous second angle data. Defaults to ``False``.
 |  site_as_coords : bool
 |      Attach radar site-coordinates to Dataset, defaults to ``True``.
 |  kwargs : dict
 |      Additional kwargs are fed to :py:func:`xarray.open_dataset`.
 |
 |  Method resolution order:
 |      GamicBackendEntrypoint
 |      xarray.backends.common.BackendEntrypoint
 |      builtins.object
 |
 |  Methods defined here:
 |
 |  open_dataset(
 |      self,
 |      filename_or_obj,
 |      *,
 |      mask_and_scale=True,
 |      decode_times=True,
 |      concat_characters=True,
 |      decode_coords=True,
 |      drop_variables=None,
 |      use_cftime=None,
 |      decode_timedelta=None,
 |      format=None,
 |      group='sweep_0',
 |      invalid_netcdf=None,
 |      phony_dims='access',
 |      decode_vlen_strings=True,
 |      first_dim='auto',
 |      reindex_angle=False,
 |      fix_second_angle=False,
 |      site_as_coords=True
 |  )
 |      Backend open_dataset method used by Xarray in :py:func:`~xarray.open_dataset`.
 |
 |  ----------------------------------------------------------------------
 |  Data and other attributes defined here:
 |
 |  __annotations__ = {}
 |
 |  description = 'Open GAMIC HDF5 (.h5, .hdf5, .mvol) using h5netcdf in X...
 |
 |  open_dataset_parameters = ('filename_or_obj', 'mask_and_scale', 'decod...
 |
 |  url = 'https://xradar.rtfd.io/en/latest/io.html#gamic-hdf5'
 |
 |  ----------------------------------------------------------------------
 |  Methods inherited from xarray.backends.common.BackendEntrypoint:
 |
 |  __repr__(self) -> 'str'
 |      Return repr(self).
 |
 |  guess_can_open(self, filename_or_obj: 'T_PathFileOrDataStore') -> 'bool'
 |      Backend open_dataset method used by Xarray in :py:func:`~xarray.open_dataset`.
 |
 |  open_datatree(
 |      self,
 |      filename_or_obj: 'T_PathFileOrDataStore',
 |      *,
 |      drop_variables: 'str | Iterable[str] | None' = None
 |  ) -> 'DataTree'
 |      Backend open_datatree method used by Xarray in :py:func:`~xarray.open_datatree`.
 |
 |      If implemented, set the class variable supports_groups to True.
 |
 |  open_groups_as_dict(
 |      self,
 |      filename_or_obj: 'T_PathFileOrDataStore',
 |      *,
 |      drop_variables: 'str | Iterable[str] | None' = None
 |  ) -> 'dict[str, Dataset]'
 |      Opens a dictionary mapping from group names to Datasets.
 |
 |      Called by :py:func:`~xarray.open_groups`.
 |      This function exists to provide a universal way to open all groups in a file,
 |      before applying any additional consistency checks or requirements necessary
 |      to create a `DataTree` object (typically done using :py:meth:`~xarray.DataTree.from_dict`).
 |
 |      If implemented, set the class variable supports_groups to True.
 |
 |  ----------------------------------------------------------------------
 |  Data descriptors inherited from xarray.backends.common.BackendEntrypoint:
 |
 |  __dict__
 |      dictionary for instance variables
 |
 |  __weakref__
 |      list of weak references to the object
 |
 |  ----------------------------------------------------------------------
 |  Data and other attributes inherited from xarray.backends.common.BackendEntrypoint:
 |
 |  supports_groups = False
ds = xr.open_dataset(filename, group="sweep_9", engine="gamic", first_dim="time")
display(ds)
<xarray.Dataset> Size: 17MB
Dimensions:            (time: 360, range: 1000)
Coordinates:
  * time               (time) datetime64[ns] 3kB 2018-06-01T05:43:40.504000 ....
    elevation          (time) float64 3kB ...
    azimuth            (time) float64 3kB ...
  * range              (range) float32 4kB 75.0 225.0 ... 1.498e+05 1.499e+05
    longitude          float64 8B ...
    latitude           float64 8B ...
    altitude           float64 8B ...
Data variables: (12/18)
    DBZH               (time, range) float32 1MB ...
    DBZV               (time, range) float32 1MB ...
    KDP                (time, range) float32 1MB ...
    RHOHV              (time, range) float32 1MB ...
    DBTH               (time, range) float32 1MB ...
    DBTV               (time, range) float32 1MB ...
    ...                 ...
    sweep_mode         <U20 80B ...
    sweep_number       int64 8B ...
    prt_mode           <U7 28B ...
    follow_mode        <U7 28B ...
    sweep_fixed_angle  float64 8B ...
    nyquist_velocity   float64 8B ...
Attributes:
    source:         gamic
    ant_gain_h:     43
    ant_gain_v:     43
    noise_power_h:  -3.40133
    noise_power_v:  -3.13518
    rx_loss_h:      3
rx_loss_v: 3open_odim_datatree#
The same works analoguous with the datatree loader. But additionally we can provide a sweep string, number or list.
help(xd.io.open_gamic_datatree)
Help on function open_gamic_datatree in module xradar.io.backends.gamic:

open_gamic_datatree(filename_or_obj, **kwargs)
    Open GAMIC HDF5 dataset as :py:class:`xarray.DataTree`.

    Parameters
    ----------
    filename_or_obj : str, Path, file-like or DataStore
        Strings and Path objects are interpreted as a path to a local or remote
        radar file

    Keyword Arguments
    -----------------
    sweep : int, list of int, optional
        Sweep number(s) to extract, default to first sweep. If None, all sweeps are
        extracted into a list.
    first_dim : str
        Can be ``time`` or ``auto`` first dimension. If set to ``auto``,
        first dimension will be either ``azimuth`` or ``elevation`` depending on
        type of sweep. Defaults to ``auto``.
    reindex_angle : bool or dict
        Defaults to False, no reindexing. Given dict should contain the kwargs to
        reindex_angle. Only invoked if `decode_coord=True`.
    fix_second_angle : bool
        If True, fixes erroneous second angle data. Defaults to ``False``.
    site_as_coords : bool
        Attach radar site-coordinates to Dataset, defaults to ``True``.
    kwargs : dict
        Additional kwargs are fed to :py:func:`xarray.open_dataset`.

    Returns
    -------
    dtree: xarray.DataTree
        DataTree
dtree = xd.io.open_gamic_datatree(filename, sweep=8)
display(dtree)
<xarray.DataTree>
Group: /
│   Dimensions:              (sweep: 1)
│   Coordinates:
│       latitude             float64 8B ...
│       longitude            float64 8B ...
│       altitude             float64 8B ...
│   Dimensions without coordinates: sweep
│   Data variables:
│       volume_number        int64 8B 0
│       platform_type        <U5 20B 'fixed'
│       instrument_type      <U5 20B 'radar'
│       time_coverage_start  <U20 80B '2018-06-01T05:43:08Z'
│       time_coverage_end    <U20 80B '2018-06-01T05:43:38Z'
│       sweep_group_name     (sweep) int64 8B 8
│       sweep_fixed_angle    (sweep) float64 8B 1.7
│   Attributes:
│       Conventions:      None
│       instrument_name:  None
│       version:          None
│       title:            None
│       institution:      None
│       references:       None
│       source:           gamic
│       history:          None
│       comment:          im/exported using xradar
└── Group: /sweep_0
        Dimensions:            (azimuth: 360, range: 1000)
        Coordinates:
          * azimuth            (azimuth) float64 3kB 0.5191 1.516 2.516 ... 358.5 359.5
            elevation          (azimuth) float64 3kB ...
            time               (azimuth) datetime64[ns] 3kB 2018-06-01T05:43:17.69900...
          * range              (range) float32 4kB 75.0 225.0 ... 1.498e+05 1.499e+05
        Data variables: (12/18)
            DBZH               (azimuth, range) float32 1MB ...
            DBZV               (azimuth, range) float32 1MB ...
            KDP                (azimuth, range) float32 1MB ...
            RHOHV              (azimuth, range) float32 1MB ...
            DBTH               (azimuth, range) float32 1MB ...
            DBTV               (azimuth, range) float32 1MB ...
            ...                 ...
            sweep_mode         <U20 80B ...
            sweep_number       int64 8B ...
            prt_mode           <U7 28B ...
            follow_mode        <U7 28B ...
            sweep_fixed_angle  float64 8B ...
nyquist_velocity float64 8B ...Plot Sweep Range vs. Time#
dtree["sweep_0"].ds.DBZH.sortby("time").plot(y="time")
<matplotlib.collections.QuadMesh at 0x74cc21723d90>
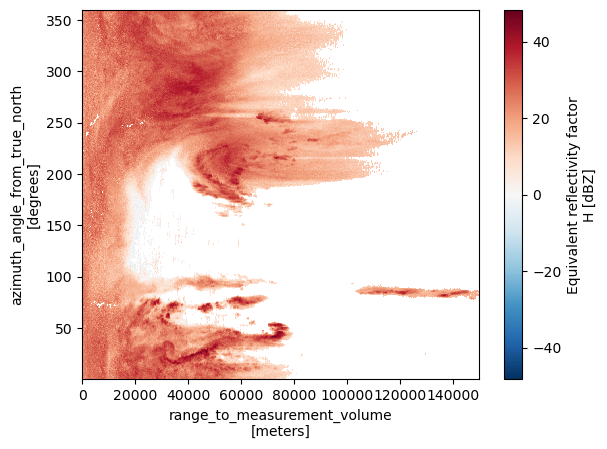
Plot Sweep Range vs. Azimuth#
dtree["sweep_0"].ds.DBZH.plot()
<matplotlib.collections.QuadMesh at 0x74cc1b723610>
dtree = xd.io.open_gamic_datatree(filename, sweep="sweep_8")
display(dtree)
<xarray.DataTree>
Group: /
│   Dimensions:              (sweep: 1)
│   Coordinates:
│       latitude             float64 8B ...
│       longitude            float64 8B ...
│       altitude             float64 8B ...
│   Dimensions without coordinates: sweep
│   Data variables:
│       volume_number        int64 8B 0
│       platform_type        <U5 20B 'fixed'
│       instrument_type      <U5 20B 'radar'
│       time_coverage_start  <U20 80B '2018-06-01T05:43:08Z'
│       time_coverage_end    <U20 80B '2018-06-01T05:43:38Z'
│       sweep_group_name     (sweep) int64 8B 8
│       sweep_fixed_angle    (sweep) float64 8B 1.7
│   Attributes:
│       Conventions:      None
│       instrument_name:  None
│       version:          None
│       title:            None
│       institution:      None
│       references:       None
│       source:           gamic
│       history:          None
│       comment:          im/exported using xradar
└── Group: /sweep_0
        Dimensions:            (azimuth: 360, range: 1000)
        Coordinates:
          * azimuth            (azimuth) float64 3kB 0.5191 1.516 2.516 ... 358.5 359.5
            elevation          (azimuth) float64 3kB ...
            time               (azimuth) datetime64[ns] 3kB 2018-06-01T05:43:17.69900...
          * range              (range) float32 4kB 75.0 225.0 ... 1.498e+05 1.499e+05
        Data variables: (12/18)
            DBZH               (azimuth, range) float32 1MB ...
            DBZV               (azimuth, range) float32 1MB ...
            KDP                (azimuth, range) float32 1MB ...
            RHOHV              (azimuth, range) float32 1MB ...
            DBTH               (azimuth, range) float32 1MB ...
            DBTV               (azimuth, range) float32 1MB ...
            ...                 ...
            sweep_mode         <U20 80B ...
            sweep_number       int64 8B ...
            prt_mode           <U7 28B ...
            follow_mode        <U7 28B ...
            sweep_fixed_angle  float64 8B ...
nyquist_velocity float64 8B ...dtree = xd.io.open_gamic_datatree(filename, sweep=[0, 1, 8])
display(dtree)
<xarray.DataTree>
Group: /
│   Dimensions:              (sweep: 3)
│   Coordinates:
│       latitude             float64 8B ...
│       longitude            float64 8B ...
│       altitude             float64 8B ...
│   Dimensions without coordinates: sweep
│   Data variables:
│       volume_number        int64 8B 0
│       platform_type        <U5 20B 'fixed'
│       instrument_type      <U5 20B 'radar'
│       time_coverage_start  <U20 80B '2018-06-01T05:40:47Z'
│       time_coverage_end    <U20 80B '2018-06-01T05:43:38Z'
│       sweep_group_name     (sweep) int64 24B 0 1 8
│       sweep_fixed_angle    (sweep) float64 24B 28.0 18.0 1.7
│   Attributes:
│       Conventions:      None
│       instrument_name:  None
│       version:          None
│       title:            None
│       institution:      None
│       references:       None
│       source:           gamic
│       history:          None
│       comment:          im/exported using xradar
├── Group: /sweep_0
│       Dimensions:            (azimuth: 361, range: 360)
│       Coordinates:
│         * azimuth            (azimuth) float64 3kB 0.5219 1.519 2.53 ... 358.5 359.5
│           elevation          (azimuth) float64 3kB ...
│           time               (azimuth) datetime64[ns] 3kB 2018-06-01T05:40:57.36300...
│         * range              (range) float32 1kB 50.0 150.0 ... 3.585e+04 3.595e+04
│       Data variables: (12/18)
│           DBZH               (azimuth, range) float32 520kB ...
│           DBZV               (azimuth, range) float32 520kB ...
│           KDP                (azimuth, range) float32 520kB ...
│           RHOHV              (azimuth, range) float32 520kB ...
│           DBTH               (azimuth, range) float32 520kB ...
│           DBTV               (azimuth, range) float32 520kB ...
│           ...                 ...
│           sweep_mode         <U20 80B ...
│           sweep_number       int64 8B ...
│           prt_mode           <U7 28B ...
│           follow_mode        <U7 28B ...
│           sweep_fixed_angle  float64 8B ...
│           nyquist_velocity   float64 8B ...
├── Group: /sweep_1
│       Dimensions:            (azimuth: 361, range: 500)
│       Coordinates:
│         * azimuth            (azimuth) float64 3kB 0.5246 1.533 2.543 ... 358.5 359.5
│           elevation          (azimuth) float64 3kB ...
│           time               (azimuth) datetime64[ns] 3kB 2018-06-01T05:41:10.99700...
│         * range              (range) float32 2kB 50.0 150.0 ... 4.985e+04 4.995e+04
│       Data variables: (12/18)
│           DBZH               (azimuth, range) float32 722kB ...
│           DBZV               (azimuth, range) float32 722kB ...
│           KDP                (azimuth, range) float32 722kB ...
│           RHOHV              (azimuth, range) float32 722kB ...
│           DBTH               (azimuth, range) float32 722kB ...
│           DBTV               (azimuth, range) float32 722kB ...
│           ...                 ...
│           sweep_mode         <U20 80B ...
│           sweep_number       int64 8B ...
│           prt_mode           <U7 28B ...
│           follow_mode        <U7 28B ...
│           sweep_fixed_angle  float64 8B ...
│           nyquist_velocity   float64 8B ...
└── Group: /sweep_2
        Dimensions:            (azimuth: 360, range: 1000)
        Coordinates:
          * azimuth            (azimuth) float64 3kB 0.5191 1.516 2.516 ... 358.5 359.5
            elevation          (azimuth) float64 3kB ...
            time               (azimuth) datetime64[ns] 3kB 2018-06-01T05:43:17.69900...
          * range              (range) float32 4kB 75.0 225.0 ... 1.498e+05 1.499e+05
        Data variables: (12/18)
            DBZH               (azimuth, range) float32 1MB ...
            DBZV               (azimuth, range) float32 1MB ...
            KDP                (azimuth, range) float32 1MB ...
            RHOHV              (azimuth, range) float32 1MB ...
            DBTH               (azimuth, range) float32 1MB ...
            DBTV               (azimuth, range) float32 1MB ...
            ...                 ...
            sweep_mode         <U20 80B ...
            sweep_number       int64 8B ...
            prt_mode           <U7 28B ...
            follow_mode        <U7 28B ...
            sweep_fixed_angle  float64 8B ...
nyquist_velocity float64 8B ...dtree = xd.io.open_gamic_datatree(filename, sweep=["sweep_1", "sweep_2", "sweep_8"])
display(dtree)
<xarray.DataTree>
Group: /
│   Dimensions:              (sweep: 3)
│   Coordinates:
│       latitude             float64 8B ...
│       longitude            float64 8B ...
│       altitude             float64 8B ...
│   Dimensions without coordinates: sweep
│   Data variables:
│       volume_number        int64 8B 0
│       platform_type        <U5 20B 'fixed'
│       instrument_type      <U5 20B 'radar'
│       time_coverage_start  <U20 80B '2018-06-01T05:41:01Z'
│       time_coverage_end    <U20 80B '2018-06-01T05:43:38Z'
│       sweep_group_name     (sweep) int64 24B 1 2 8
│       sweep_fixed_angle    (sweep) float64 24B 18.0 14.0 1.7
│   Attributes:
│       Conventions:      None
│       instrument_name:  None
│       version:          None
│       title:            None
│       institution:      None
│       references:       None
│       source:           gamic
│       history:          None
│       comment:          im/exported using xradar
├── Group: /sweep_0
│       Dimensions:            (azimuth: 361, range: 500)
│       Coordinates:
│         * azimuth            (azimuth) float64 3kB 0.5246 1.533 2.543 ... 358.5 359.5
│           elevation          (azimuth) float64 3kB ...
│           time               (azimuth) datetime64[ns] 3kB 2018-06-01T05:41:10.99700...
│         * range              (range) float32 2kB 50.0 150.0 ... 4.985e+04 4.995e+04
│       Data variables: (12/18)
│           DBZH               (azimuth, range) float32 722kB ...
│           DBZV               (azimuth, range) float32 722kB ...
│           KDP                (azimuth, range) float32 722kB ...
│           RHOHV              (azimuth, range) float32 722kB ...
│           DBTH               (azimuth, range) float32 722kB ...
│           DBTV               (azimuth, range) float32 722kB ...
│           ...                 ...
│           sweep_mode         <U20 80B ...
│           sweep_number       int64 8B ...
│           prt_mode           <U7 28B ...
│           follow_mode        <U7 28B ...
│           sweep_fixed_angle  float64 8B ...
│           nyquist_velocity   float64 8B ...
├── Group: /sweep_1
│       Dimensions:            (azimuth: 361, range: 620)
│       Coordinates:
│         * azimuth            (azimuth) float64 3kB 0.5191 1.524 2.527 ... 358.5 359.5
│           elevation          (azimuth) float64 3kB ...
│           time               (azimuth) datetime64[ns] 3kB 2018-06-01T05:41:24.84300...
│         * range              (range) float32 2kB 50.0 150.0 ... 6.185e+04 6.195e+04
│       Data variables: (12/18)
│           DBZH               (azimuth, range) float32 895kB ...
│           DBZV               (azimuth, range) float32 895kB ...
│           KDP                (azimuth, range) float32 895kB ...
│           RHOHV              (azimuth, range) float32 895kB ...
│           DBTH               (azimuth, range) float32 895kB ...
│           DBTV               (azimuth, range) float32 895kB ...
│           ...                 ...
│           sweep_mode         <U20 80B ...
│           sweep_number       int64 8B ...
│           prt_mode           <U7 28B ...
│           follow_mode        <U7 28B ...
│           sweep_fixed_angle  float64 8B ...
│           nyquist_velocity   float64 8B ...
└── Group: /sweep_2
        Dimensions:            (azimuth: 360, range: 1000)
        Coordinates:
          * azimuth            (azimuth) float64 3kB 0.5191 1.516 2.516 ... 358.5 359.5
            elevation          (azimuth) float64 3kB ...
            time               (azimuth) datetime64[ns] 3kB 2018-06-01T05:43:17.69900...
          * range              (range) float32 4kB 75.0 225.0 ... 1.498e+05 1.499e+05
        Data variables: (12/18)
            DBZH               (azimuth, range) float32 1MB ...
            DBZV               (azimuth, range) float32 1MB ...
            KDP                (azimuth, range) float32 1MB ...
            RHOHV              (azimuth, range) float32 1MB ...
            DBTH               (azimuth, range) float32 1MB ...
            DBTV               (azimuth, range) float32 1MB ...
            ...                 ...
            sweep_mode         <U20 80B ...
            sweep_number       int64 8B ...
            prt_mode           <U7 28B ...
            follow_mode        <U7 28B ...
            sweep_fixed_angle  float64 8B ...
            nyquist_velocity   float64 8B ...