Rainbow#
import xarray as xr
from open_radar_data import DATASETS

import xradar as xd
Download#
Fetching Rainbow radar data file from open-radar-data repository.
filename = DATASETS.fetch("2013051000000600dBZ.vol")
Downloading file '2013051000000600dBZ.vol' from 'https://github.com/openradar/open-radar-data/raw/main/data/2013051000000600dBZ.vol' to '/home/docs/.cache/open-radar-data'.
xr.open_dataset#
Making use of the xarray rainbow backend. We also need to provide the group. Note, that we are using CfRadial2 group access pattern.
ds = xr.open_dataset(filename, group="sweep_0", engine="rainbow")
display(ds)
<xarray.Dataset> Size: 1MB
Dimensions:            (azimuth: 361, range: 400)
Coordinates:
  * azimuth            (azimuth) float64 3kB 0.5055 1.549 2.505 ... 358.5 359.5
    elevation          (azimuth) float64 3kB ...
    time               (azimuth) datetime64[ns] 3kB ...
  * range              (range) float32 2kB 125.0 375.0 ... 9.962e+04 9.988e+04
    longitude          float64 8B ...
    latitude           float64 8B ...
    altitude           float64 8B ...
Data variables:
    DBZH               (azimuth, range) float64 1MB ...
    sweep_mode         <U20 80B ...
    sweep_number       int64 8B ...
    prt_mode           <U7 28B ...
    follow_mode        <U7 28B ...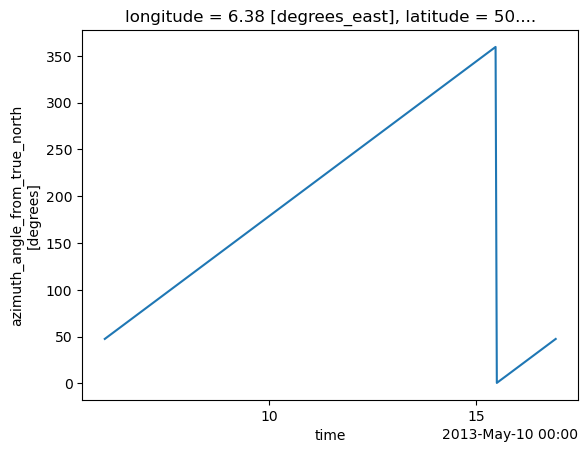
sweep_fixed_angle float64 8B ...Plot Time vs. Azimuth#
We need to sort by time and specify the coordinate.
ds.azimuth.sortby("time").plot(x="time")
[<matplotlib.lines.Line2D at 0x7cc21db16210>]
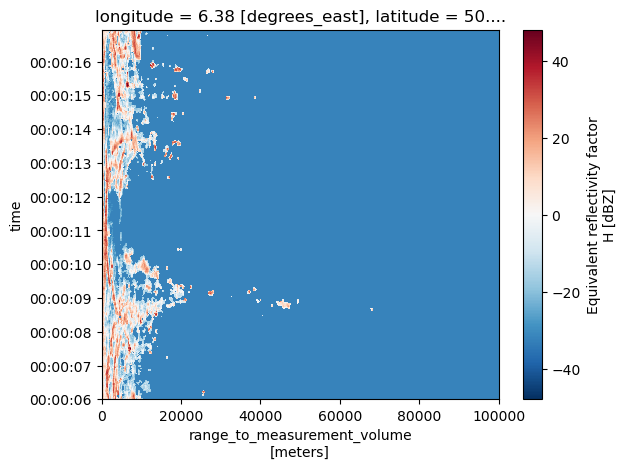
Plot Range vs. Time#
We need to sort by time and specify the coordinate.
ds.DBZH.sortby("time").plot(y="time")
<matplotlib.collections.QuadMesh at 0x7cc21d9d5fd0>
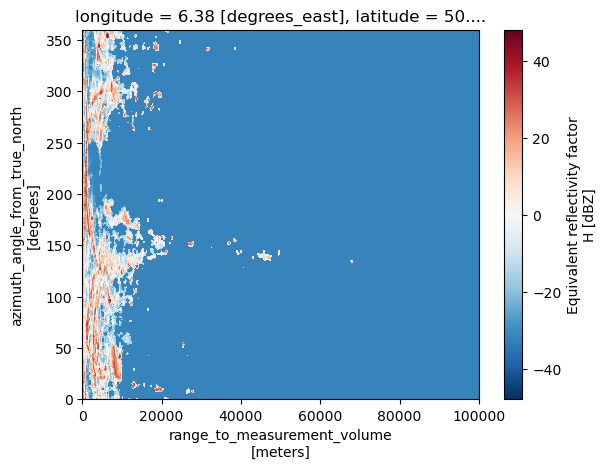
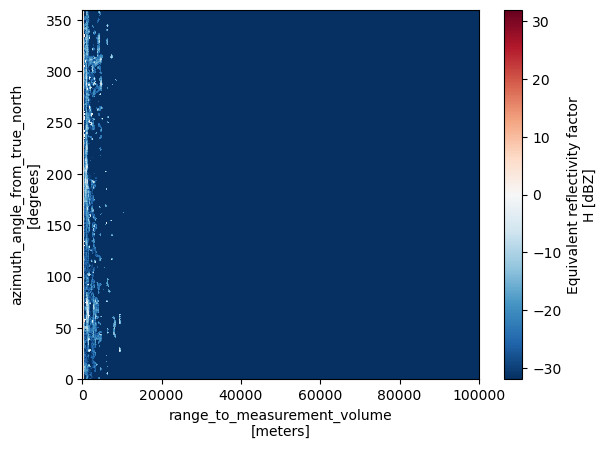
Plot Range vs. Azimuth#
ds.DBZH.plot()
<matplotlib.collections.QuadMesh at 0x7cc214f8de50>
backend_kwargs#
Beside first_dim there are several additional backend_kwargs for the rainbow backend, which handle different aspects of angle alignment. This comes into play, when azimuth and/or elevation arrays are not evenly spacend and other issues.
help(xd.io.RainbowBackendEntrypoint)
Help on class RainbowBackendEntrypoint in module xradar.io.backends.rainbow:

class RainbowBackendEntrypoint(xarray.backends.common.BackendEntrypoint)
 |  Xarray BackendEntrypoint for Rainbow5 data.
 |
 |  Method resolution order:
 |      RainbowBackendEntrypoint
 |      xarray.backends.common.BackendEntrypoint
 |      builtins.object
 |
 |  Methods defined here:
 |
 |  open_dataset(
 |      self,
 |      filename_or_obj,
 |      *,
 |      mask_and_scale=True,
 |      decode_times=True,
 |      concat_characters=True,
 |      decode_coords=True,
 |      drop_variables=None,
 |      use_cftime=None,
 |      decode_timedelta=None,
 |      group=None,
 |      reindex_angle=False,
 |      first_dim='auto',
 |      site_as_coords=True
 |  )
 |      Backend open_dataset method used by Xarray in :py:func:`~xarray.open_dataset`.
 |
 |  ----------------------------------------------------------------------
 |  Data and other attributes defined here:
 |
 |  __annotations__ = {}
 |
 |  description = 'Open Rainbow5 files in Xarray'
 |
 |  open_dataset_parameters = ('filename_or_obj', 'mask_and_scale', 'decod...
 |
 |  url = 'https://xradar.rtfd.io/latest/io.html#rainbow-data-i-o'
 |
 |  ----------------------------------------------------------------------
 |  Methods inherited from xarray.backends.common.BackendEntrypoint:
 |
 |  __repr__(self) -> 'str'
 |      Return repr(self).
 |
 |  guess_can_open(self, filename_or_obj: 'T_PathFileOrDataStore') -> 'bool'
 |      Backend open_dataset method used by Xarray in :py:func:`~xarray.open_dataset`.
 |
 |  open_datatree(
 |      self,
 |      filename_or_obj: 'T_PathFileOrDataStore',
 |      *,
 |      drop_variables: 'str | Iterable[str] | None' = None
 |  ) -> 'DataTree'
 |      Backend open_datatree method used by Xarray in :py:func:`~xarray.open_datatree`.
 |
 |      If implemented, set the class variable supports_groups to True.
 |
 |  open_groups_as_dict(
 |      self,
 |      filename_or_obj: 'T_PathFileOrDataStore',
 |      *,
 |      drop_variables: 'str | Iterable[str] | None' = None
 |  ) -> 'dict[str, Dataset]'
 |      Opens a dictionary mapping from group names to Datasets.
 |
 |      Called by :py:func:`~xarray.open_groups`.
 |      This function exists to provide a universal way to open all groups in a file,
 |      before applying any additional consistency checks or requirements necessary
 |      to create a `DataTree` object (typically done using :py:meth:`~xarray.DataTree.from_dict`).
 |
 |      If implemented, set the class variable supports_groups to True.
 |
 |  ----------------------------------------------------------------------
 |  Data descriptors inherited from xarray.backends.common.BackendEntrypoint:
 |
 |  __dict__
 |      dictionary for instance variables
 |
 |  __weakref__
 |      list of weak references to the object
 |
 |  ----------------------------------------------------------------------
 |  Data and other attributes inherited from xarray.backends.common.BackendEntrypoint:
 |
 |  supports_groups = False
ds = xr.open_dataset(filename, group="sweep_1", engine="rainbow", first_dim="time")
display(ds)
<xarray.Dataset> Size: 1MB
Dimensions:            (time: 361, range: 400)
Coordinates:
  * time               (time) datetime64[ns] 3kB 2013-05-10T00:00:19.01515150...
    azimuth            (time) float64 3kB ...
    elevation          (time) float64 3kB ...
  * range              (range) float32 2kB 125.0 375.0 ... 9.962e+04 9.988e+04
    longitude          float64 8B ...
    latitude           float64 8B ...
    altitude           float64 8B ...
Data variables:
    DBZH               (time, range) float64 1MB ...
    sweep_mode         <U20 80B ...
    sweep_number       int64 8B ...
    prt_mode           <U7 28B ...
    follow_mode        <U7 28B ...
sweep_fixed_angle float64 8B ...open_odim_datatree#
The same works analoguous with the datatree loader. But additionally we can provide a sweep string, number or list.
help(xd.io.open_rainbow_datatree)
Help on function open_rainbow_datatree in module xradar.io.backends.rainbow:

open_rainbow_datatree(filename_or_obj, **kwargs)
    Open ODIM_H5 dataset as :py:class:`xarray.DataTree`.

    Parameters
    ----------
    filename_or_obj : str, Path, file-like or DataStore
        Strings and Path objects are interpreted as a path to a local or remote
        radar file

    Keyword Arguments
    -----------------
    sweep : int, list of int, optional
        Sweep number(s) to extract, default to first sweep. If None, all sweeps are
        extracted into a list.
    first_dim : str
        Can be ``time`` or ``auto`` first dimension. If set to ``auto``,
        first dimension will be either ``azimuth`` or ``elevation`` depending on
        type of sweep. Defaults to ``auto``.
    reindex_angle : bool or dict
        Defaults to False, no reindexing. Given dict should contain the kwargs to
        reindex_angle. Only invoked if `decode_coord=True`.
    fix_second_angle : bool
        If True, fixes erroneous second angle data. Defaults to ``False``.
    site_as_coords : bool
        Attach radar site-coordinates to Dataset, defaults to ``True``.
    kwargs : dict
        Additional kwargs are fed to :py:func:`xarray.open_dataset`.

    Returns
    -------
    dtree: xarray.DataTree
        DataTree
dtree = xd.io.open_rainbow_datatree(filename, sweep="sweep_8")
display(dtree)
<xarray.DataTree>
Group: /
│   Dimensions:              (sweep: 1)
│   Coordinates:
│       latitude             float64 8B ...
│       longitude            float64 8B ...
│       altitude             float64 8B ...
│   Dimensions without coordinates: sweep
│   Data variables:
│       volume_number        int64 8B 0
│       platform_type        <U5 20B 'fixed'
│       instrument_type      <U5 20B 'radar'
│       time_coverage_start  <U20 80B '2013-05-10T00:01:55Z'
│       time_coverage_end    <U20 80B '2013-05-10T00:02:05Z'
│       sweep_group_name     (sweep) int64 8B 8
│       sweep_fixed_angle    (sweep) float64 8B 12.2
│   Attributes:
│       Conventions:      None
│       instrument_name:  None
│       version:          None
│       title:            None
│       institution:      None
│       references:       None
│       source:           None
│       history:          None
│       comment:          im/exported using xradar
└── Group: /sweep_0
        Dimensions:            (azimuth: 361, range: 400)
        Coordinates:
          * azimuth            (azimuth) float64 3kB 0.5 1.544 2.51 ... 358.5 359.5
            elevation          (azimuth) float64 3kB ...
            time               (azimuth) datetime64[ns] 3kB 2013-05-10T00:02:03.10606...
          * range              (range) float32 2kB 125.0 375.0 ... 9.962e+04 9.988e+04
        Data variables:
            DBZH               (azimuth, range) float64 1MB ...
            sweep_mode         <U20 80B ...
            sweep_number       int64 8B ...
            prt_mode           <U7 28B ...
            follow_mode        <U7 28B ...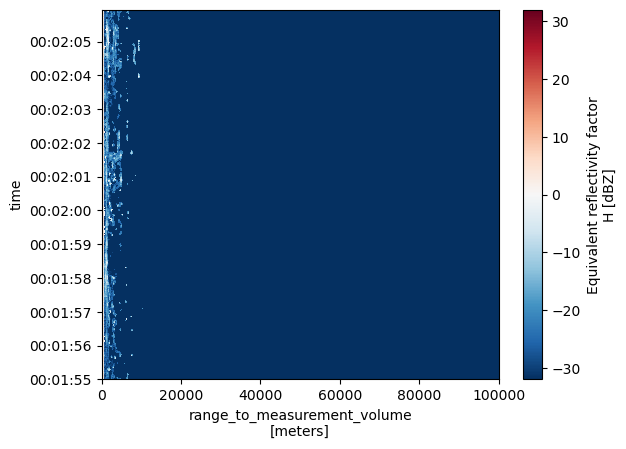
sweep_fixed_angle float64 8B ...Plot Sweep Range vs. Time#
dtree["sweep_0"].ds.DBZH.sortby("time").plot(y="time")
<matplotlib.collections.QuadMesh at 0x7cc2153ea5d0>
Plot Sweep Range vs. Azimuth#
dtree["sweep_0"].ds.DBZH.plot()
<matplotlib.collections.QuadMesh at 0x7cc21549bed0>
dtree = xd.io.open_rainbow_datatree(filename, sweep="sweep_8")
display(dtree)
<xarray.DataTree>
Group: /
│   Dimensions:              (sweep: 1)
│   Coordinates:
│       latitude             float64 8B ...
│       longitude            float64 8B ...
│       altitude             float64 8B ...
│   Dimensions without coordinates: sweep
│   Data variables:
│       volume_number        int64 8B 0
│       platform_type        <U5 20B 'fixed'
│       instrument_type      <U5 20B 'radar'
│       time_coverage_start  <U20 80B '2013-05-10T00:01:55Z'
│       time_coverage_end    <U20 80B '2013-05-10T00:02:05Z'
│       sweep_group_name     (sweep) int64 8B 8
│       sweep_fixed_angle    (sweep) float64 8B 12.2
│   Attributes:
│       Conventions:      None
│       instrument_name:  None
│       version:          None
│       title:            None
│       institution:      None
│       references:       None
│       source:           None
│       history:          None
│       comment:          im/exported using xradar
└── Group: /sweep_0
        Dimensions:            (azimuth: 361, range: 400)
        Coordinates:
          * azimuth            (azimuth) float64 3kB 0.5 1.544 2.51 ... 358.5 359.5
            elevation          (azimuth) float64 3kB ...
            time               (azimuth) datetime64[ns] 3kB 2013-05-10T00:02:03.10606...
          * range              (range) float32 2kB 125.0 375.0 ... 9.962e+04 9.988e+04
        Data variables:
            DBZH               (azimuth, range) float64 1MB ...
            sweep_mode         <U20 80B ...
            sweep_number       int64 8B ...
            prt_mode           <U7 28B ...
            follow_mode        <U7 28B ...
sweep_fixed_angle float64 8B ...dtree = xd.io.open_rainbow_datatree(filename, sweep=[0, 1, 8])
display(dtree)
<xarray.DataTree>
Group: /
│   Dimensions:              (sweep: 3)
│   Coordinates:
│       latitude             float64 8B ...
│       longitude            float64 8B ...
│       altitude             float64 8B ...
│   Dimensions without coordinates: sweep
│   Data variables:
│       volume_number        int64 8B 0
│       platform_type        <U5 20B 'fixed'
│       instrument_type      <U5 20B 'radar'
│       time_coverage_start  <U20 80B '2013-05-10T00:00:19Z'
│       time_coverage_end    <U20 80B '2013-05-10T00:02:19Z'
│       sweep_group_name     (sweep) int64 24B 1 2 9
│       sweep_fixed_angle    (sweep) float64 24B 1.4 2.4 14.8
│   Attributes:
│       Conventions:      None
│       instrument_name:  None
│       version:          None
│       title:            None
│       institution:      None
│       references:       None
│       source:           None
│       history:          None
│       comment:          im/exported using xradar
├── Group: /sweep_0
│       Dimensions:            (azimuth: 361, range: 400)
│       Coordinates:
│         * azimuth            (azimuth) float64 3kB 0.5055 1.549 2.516 ... 358.5 359.5
│           elevation          (azimuth) float64 3kB ...
│           time               (azimuth) datetime64[ns] 3kB 2013-05-10T00:00:25.62121...
│         * range              (range) float32 2kB 125.0 375.0 ... 9.962e+04 9.988e+04
│       Data variables:
│           DBZH               (azimuth, range) float64 1MB ...
│           sweep_mode         <U20 80B ...
│           sweep_number       int64 8B ...
│           prt_mode           <U7 28B ...
│           follow_mode        <U7 28B ...
│           sweep_fixed_angle  float64 8B ...
├── Group: /sweep_1
│       Dimensions:            (azimuth: 361, range: 400)
│       Coordinates:
│         * azimuth            (azimuth) float64 3kB 0.511 1.505 2.505 ... 358.5 359.5
│           elevation          (azimuth) float64 3kB ...
│           time               (azimuth) datetime64[ns] 3kB 2013-05-10T00:00:36.65151...
│         * range              (range) float32 2kB 125.0 375.0 ... 9.962e+04 9.988e+04
│       Data variables:
│           DBZH               (azimuth, range) float64 1MB ...
│           sweep_mode         <U20 80B ...
│           sweep_number       int64 8B ...
│           prt_mode           <U7 28B ...
│           follow_mode        <U7 28B ...
│           sweep_fixed_angle  float64 8B ...
└── Group: /sweep_2
        Dimensions:            (azimuth: 361, range: 400)
        Coordinates:
          * azimuth            (azimuth) float64 3kB 0.522 1.516 2.51 ... 358.5 359.5
            elevation          (azimuth) float64 3kB ...
            time               (azimuth) datetime64[ns] 3kB 2013-05-10T00:02:14.19696...
          * range              (range) float32 2kB 125.0 375.0 ... 9.962e+04 9.988e+04
        Data variables:
            DBZH               (azimuth, range) float64 1MB ...
            sweep_mode         <U20 80B ...
            sweep_number       int64 8B ...
            prt_mode           <U7 28B ...
            follow_mode        <U7 28B ...
sweep_fixed_angle float64 8B ...dtree = xd.io.open_rainbow_datatree(filename, sweep=["sweep_1", "sweep_2", "sweep_8"])
display(dtree)
<xarray.DataTree>
Group: /
│   Dimensions:              (sweep: 3)
│   Coordinates:
│       latitude             float64 8B ...
│       longitude            float64 8B ...
│       altitude             float64 8B ...
│   Dimensions without coordinates: sweep
│   Data variables:
│       volume_number        int64 8B 0
│       platform_type        <U5 20B 'fixed'
│       instrument_type      <U5 20B 'radar'
│       time_coverage_start  <U20 80B '2013-05-10T00:00:19Z'
│       time_coverage_end    <U20 80B '2013-05-10T00:02:05Z'
│       sweep_group_name     (sweep) int64 24B 1 2 8
│       sweep_fixed_angle    (sweep) float64 24B 1.4 2.4 12.2
│   Attributes:
│       Conventions:      None
│       instrument_name:  None
│       version:          None
│       title:            None
│       institution:      None
│       references:       None
│       source:           None
│       history:          None
│       comment:          im/exported using xradar
├── Group: /sweep_0
│       Dimensions:            (azimuth: 361, range: 400)
│       Coordinates:
│         * azimuth            (azimuth) float64 3kB 0.5055 1.549 2.516 ... 358.5 359.5
│           elevation          (azimuth) float64 3kB ...
│           time               (azimuth) datetime64[ns] 3kB 2013-05-10T00:00:25.62121...
│         * range              (range) float32 2kB 125.0 375.0 ... 9.962e+04 9.988e+04
│       Data variables:
│           DBZH               (azimuth, range) float64 1MB ...
│           sweep_mode         <U20 80B ...
│           sweep_number       int64 8B ...
│           prt_mode           <U7 28B ...
│           follow_mode        <U7 28B ...
│           sweep_fixed_angle  float64 8B ...
├── Group: /sweep_1
│       Dimensions:            (azimuth: 361, range: 400)
│       Coordinates:
│         * azimuth            (azimuth) float64 3kB 0.511 1.505 2.505 ... 358.5 359.5
│           elevation          (azimuth) float64 3kB ...
│           time               (azimuth) datetime64[ns] 3kB 2013-05-10T00:00:36.65151...
│         * range              (range) float32 2kB 125.0 375.0 ... 9.962e+04 9.988e+04
│       Data variables:
│           DBZH               (azimuth, range) float64 1MB ...
│           sweep_mode         <U20 80B ...
│           sweep_number       int64 8B ...
│           prt_mode           <U7 28B ...
│           follow_mode        <U7 28B ...
│           sweep_fixed_angle  float64 8B ...
└── Group: /sweep_2
        Dimensions:            (azimuth: 361, range: 400)
        Coordinates:
          * azimuth            (azimuth) float64 3kB 0.5 1.544 2.51 ... 358.5 359.5
            elevation          (azimuth) float64 3kB ...
            time               (azimuth) datetime64[ns] 3kB 2013-05-10T00:02:03.10606...
          * range              (range) float32 2kB 125.0 375.0 ... 9.962e+04 9.988e+04
        Data variables:
            DBZH               (azimuth, range) float64 1MB ...
            sweep_mode         <U20 80B ...
            sweep_number       int64 8B ...
            prt_mode           <U7 28B ...
            follow_mode        <U7 28B ...
            sweep_fixed_angle  float64 8B ...