Iris/Sigmet - Reader#
import xarray as xr
from open_radar_data import DATASETS

import xradar as xd
Download#
Fetching Iris radar data file from open-radar-data repository.
filename_single = DATASETS.fetch("SUR210819000227.RAWKPJV")
filename_volume = DATASETS.fetch("cor-main131125105503.RAW2049")
Downloading file 'SUR210819000227.RAWKPJV' from 'https://github.com/openradar/open-radar-data/raw/main/data/SUR210819000227.RAWKPJV' to '/home/docs/.cache/open-radar-data'.
Downloading file 'cor-main131125105503.RAW2049' from 'https://github.com/openradar/open-radar-data/raw/main/data/cor-main131125105503.RAW2049' to '/home/docs/.cache/open-radar-data'.
xr.open_dataset#
Making use of the xarray iris backend. We also need to provide the group. We use the group notation from CfRadial2.
ds = xr.open_dataset(filename_single, group="sweep_0", engine="iris")
display(ds)
<xarray.Dataset> Size: 13MB
Dimensions:            (azimuth: 359, range: 833)
Coordinates:
  * azimuth            (azimuth) float32 1kB 0.03021 1.035 2.054 ... 358.0 359.0
    elevation          (azimuth) float32 1kB ...
    time               (azimuth) datetime64[ns] 3kB ...
  * range              (range) float32 3kB 150.0 450.0 ... 2.494e+05 2.498e+05
    longitude          float64 8B ...
    latitude           float64 8B ...
    altitude           float64 8B ...
Data variables: (12/16)
    DBTH               (azimuth, range) float32 1MB ...
    DBZH               (azimuth, range) float32 1MB ...
    VRADH              (azimuth, range) float32 1MB ...
    WRADH              (azimuth, range) float32 1MB ...
    ZDR                (azimuth, range) float32 1MB ...
    KDP                (azimuth, range) float32 1MB ...
    ...                 ...
    SNRH               (azimuth, range) float32 1MB ...
    sweep_mode         <U20 80B ...
    sweep_number       int64 8B ...
    prt_mode           <U7 28B ...
    follow_mode        <U7 28B ...
    sweep_fixed_angle  float64 8B ...
Attributes:
    source:           Sigmet
    scan_name:        PPI1_H
    instrument_name:  Surgavere, Radar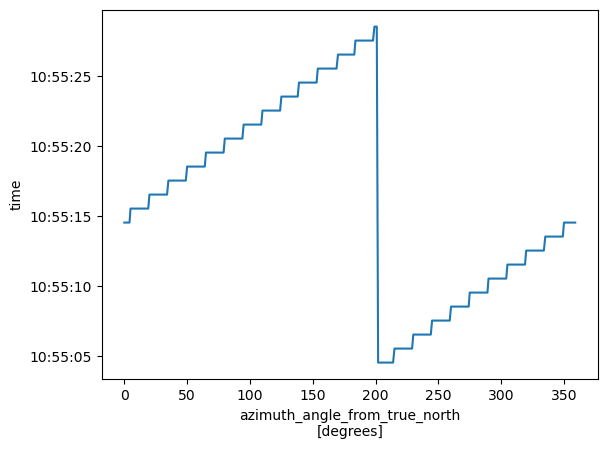
comment: Dual pol 250km hybrid surveillance task 0.5 deg 2.5minu...Plot Time vs. Azimuth#
ds.azimuth.plot(y="time")
[<matplotlib.lines.Line2D at 0x703e78f4e490>]
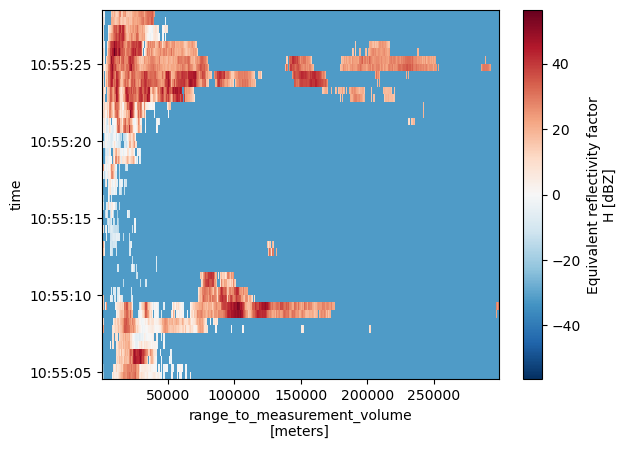
Plot Range vs. Time#
We need to sort by time and specify the y-coordinate.
ds.DBZH.sortby("time").plot(y="time")
<matplotlib.collections.QuadMesh at 0x703e78e09d30>
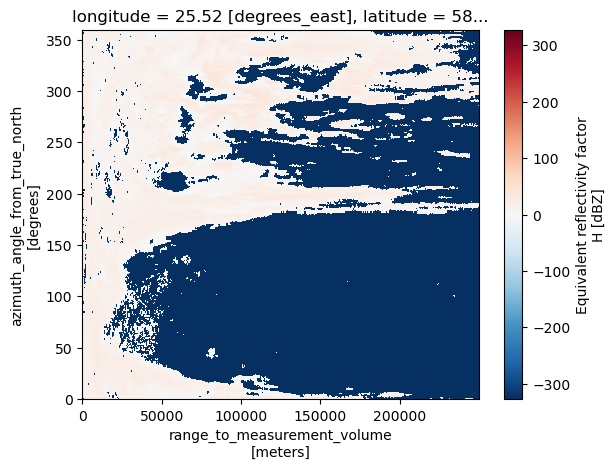
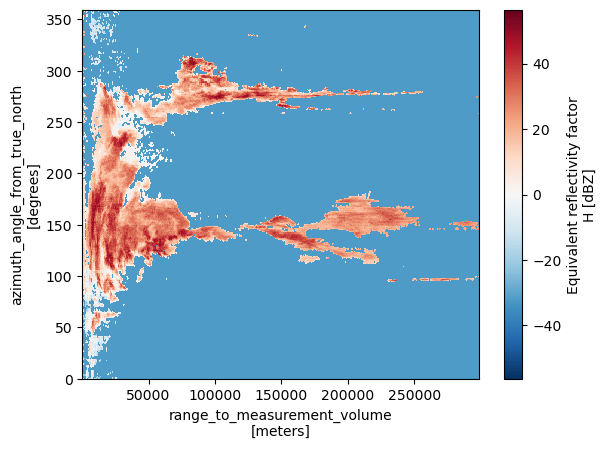
Plot Range vs. Azimuth#
ds.DBZH.plot(y="azimuth")
<matplotlib.collections.QuadMesh at 0x703e78d44f50>
backend_kwargs#
Beside first_dim there are several additional backend_kwargs for the iris backend, which handle different aspects of angle alignment. This comes into play, when azimuth and/or elevation arrays are not evenly spacend and other issues.
help(xd.io.IrisBackendEntrypoint)
Help on class IrisBackendEntrypoint in module xradar.io.backends.iris:

class IrisBackendEntrypoint(xarray.backends.common.BackendEntrypoint)
 |  Xarray BackendEntrypoint for IRIS/Sigmet data.
 |
 |  Method resolution order:
 |      IrisBackendEntrypoint
 |      xarray.backends.common.BackendEntrypoint
 |      builtins.object
 |
 |  Methods defined here:
 |
 |  open_dataset(
 |      self,
 |      filename_or_obj,
 |      *,
 |      mask_and_scale=True,
 |      decode_times=True,
 |      concat_characters=True,
 |      decode_coords=True,
 |      drop_variables=None,
 |      use_cftime=None,
 |      decode_timedelta=None,
 |      group=None,
 |      lock=None,
 |      first_dim='auto',
 |      reindex_angle=False,
 |      fix_second_angle=False,
 |      site_as_coords=True,
 |      optional=True
 |  )
 |      Backend open_dataset method used by Xarray in :py:func:`~xarray.open_dataset`.
 |
 |  ----------------------------------------------------------------------
 |  Data and other attributes defined here:
 |
 |  __annotations__ = {}
 |
 |  description = 'Open IRIS/Sigmet files in Xarray'
 |
 |  open_dataset_parameters = ('filename_or_obj', 'mask_and_scale', 'decod...
 |
 |  url = 'https://xradar.rtfd.io/latest/io.html#iris-sigmet-data-i-o'
 |
 |  ----------------------------------------------------------------------
 |  Methods inherited from xarray.backends.common.BackendEntrypoint:
 |
 |  __repr__(self) -> 'str'
 |      Return repr(self).
 |
 |  guess_can_open(self, filename_or_obj: 'T_PathFileOrDataStore') -> 'bool'
 |      Backend open_dataset method used by Xarray in :py:func:`~xarray.open_dataset`.
 |
 |  open_datatree(
 |      self,
 |      filename_or_obj: 'T_PathFileOrDataStore',
 |      *,
 |      drop_variables: 'str | Iterable[str] | None' = None
 |  ) -> 'DataTree'
 |      Backend open_datatree method used by Xarray in :py:func:`~xarray.open_datatree`.
 |
 |      If implemented, set the class variable supports_groups to True.
 |
 |  open_groups_as_dict(
 |      self,
 |      filename_or_obj: 'T_PathFileOrDataStore',
 |      *,
 |      drop_variables: 'str | Iterable[str] | None' = None
 |  ) -> 'dict[str, Dataset]'
 |      Opens a dictionary mapping from group names to Datasets.
 |
 |      Called by :py:func:`~xarray.open_groups`.
 |      This function exists to provide a universal way to open all groups in a file,
 |      before applying any additional consistency checks or requirements necessary
 |      to create a `DataTree` object (typically done using :py:meth:`~xarray.DataTree.from_dict`).
 |
 |      If implemented, set the class variable supports_groups to True.
 |
 |  ----------------------------------------------------------------------
 |  Data descriptors inherited from xarray.backends.common.BackendEntrypoint:
 |
 |  __dict__
 |      dictionary for instance variables
 |
 |  __weakref__
 |      list of weak references to the object
 |
 |  ----------------------------------------------------------------------
 |  Data and other attributes inherited from xarray.backends.common.BackendEntrypoint:
 |
 |  supports_groups = False
ds = xr.open_dataset(filename_single, group="sweep_0", engine="iris", first_dim="time")
display(ds)
<xarray.Dataset> Size: 13MB
Dimensions:            (time: 359, range: 833)
Coordinates:
  * time               (time) datetime64[ns] 3kB 2021-08-19T00:02:28.029000 ....
    azimuth            (time) float32 1kB ...
    elevation          (time) float32 1kB ...
  * range              (range) float32 3kB 150.0 450.0 ... 2.494e+05 2.498e+05
    longitude          float64 8B ...
    latitude           float64 8B ...
    altitude           float64 8B ...
Data variables: (12/16)
    DBTH               (time, range) float32 1MB ...
    DBZH               (time, range) float32 1MB ...
    VRADH              (time, range) float32 1MB ...
    WRADH              (time, range) float32 1MB ...
    ZDR                (time, range) float32 1MB ...
    KDP                (time, range) float32 1MB ...
    ...                 ...
    SNRH               (time, range) float32 1MB ...
    sweep_mode         <U20 80B ...
    sweep_number       int64 8B ...
    prt_mode           <U7 28B ...
    follow_mode        <U7 28B ...
    sweep_fixed_angle  float64 8B ...
Attributes:
    source:           Sigmet
    scan_name:        PPI1_H
    instrument_name:  Surgavere, Radar
comment: Dual pol 250km hybrid surveillance task 0.5 deg 2.5minu...open_iris_datatree#
The same works analoguous with the datatree loader. But additionally we can provide a sweep string, number or list. The underlying xarray.Dataset can be accessed with property .ds.
help(xd.io.open_iris_datatree)
Help on function open_iris_datatree in module xradar.io.backends.iris:

open_iris_datatree(filename_or_obj, **kwargs)
    Open Iris/Sigmet dataset as :py:class:`xarray.DataTree`.

    Parameters
    ----------
    filename_or_obj : str, Path, file-like or DataStore
        Strings and Path objects are interpreted as a path to a local or remote
        radar file

    Keyword Arguments
    -----------------
    sweep : int, list of int, optional
        Sweep number(s) to extract, default to first sweep. If None, all sweeps are
        extracted into a list.
    first_dim : str
        Can be ``time`` or ``auto`` first dimension. If set to ``auto``,
        first dimension will be either ``azimuth`` or ``elevation`` depending on
        type of sweep. Defaults to ``auto``.
    reindex_angle : bool or dict
        Defaults to False, no reindexing. Given dict should contain the kwargs to
        reindex_angle. Only invoked if `decode_coord=True`.
    fix_second_angle : bool
        If True, fixes erroneous second angle data. Defaults to ``False``.
    site_as_coords : bool
        Attach radar site-coordinates to Dataset, defaults to ``True``.
    kwargs : dict
        Additional kwargs are fed to :py:func:`xarray.open_dataset`.

    Returns
    -------
    dtree: xarray.DataTree
        DataTree
dtree = xd.io.open_iris_datatree(filename_volume)
display(dtree)
<xarray.DataTree>
Group: /
│   Dimensions:              (sweep: 10)
│   Coordinates:
│       latitude             float64 8B ...
│       longitude            float64 8B ...
│       altitude             float64 8B ...
│   Dimensions without coordinates: sweep
│   Data variables:
│       volume_number        int64 8B 0
│       platform_type        <U5 20B 'fixed'
│       instrument_type      <U5 20B 'radar'
│       time_coverage_start  <U20 80B '2013-11-25T10:55:04Z'
│       time_coverage_end    <U20 80B '2013-11-25T10:59:24Z'
│       sweep_group_name     (sweep) int64 80B 0 1 2 3 4 5 6 7 8 9
│       sweep_fixed_angle    (sweep) float64 80B 0.5 1.0 2.0 3.0 ... 15.0 20.0 30.0
│   Attributes:
│       Conventions:      None
│       instrument_name:  Corozal, Radar
│       version:          None
│       title:            None
│       institution:      None
│       references:       None
│       source:           Sigmet
│       history:          None
│       comment:          AEROCIVIL OPERATIONAL DUAL POLE SCAN
│       scan_name:        SURV_HV_300
├── Group: /sweep_0
│       Dimensions:            (azimuth: 360, range: 664)
│       Coordinates:
│         * azimuth            (azimuth) float32 1kB 0.02197 1.134 2.09 ... 358.0 359.0
│           elevation          (azimuth) float32 1kB ...
│           time               (azimuth) datetime64[ns] 3kB 2013-11-25T10:55:14.54100...
│         * range              (range) float32 3kB 300.0 750.0 ... 2.982e+05 2.986e+05
│       Data variables:
│           DBZH               (azimuth, range) float32 956kB ...
│           VRADH              (azimuth, range) float32 956kB ...
│           ZDR                (azimuth, range) float32 956kB ...
│           KDP                (azimuth, range) float32 956kB ...
│           PHIDP              (azimuth, range) float32 956kB ...
│           RHOHV              (azimuth, range) float32 956kB ...
│           DB_HCLASS          (azimuth, range) int16 478kB ...
│           sweep_mode         <U20 80B ...
│           sweep_number       int64 8B ...
│           prt_mode           <U7 28B ...
│           follow_mode        <U7 28B ...
│           sweep_fixed_angle  float64 8B ...
├── Group: /sweep_1
│       Dimensions:            (azimuth: 360, range: 664)
│       Coordinates:
│         * azimuth            (azimuth) float32 1kB 0.06042 1.016 2.054 ... 358.0 359.0
│           elevation          (azimuth) float32 1kB ...
│           time               (azimuth) datetime64[ns] 3kB 2013-11-25T10:55:38.62000...
│         * range              (range) float32 3kB 300.0 750.0 ... 2.982e+05 2.986e+05
│       Data variables:
│           DBZH               (azimuth, range) float32 956kB ...
│           VRADH              (azimuth, range) float32 956kB ...
│           ZDR                (azimuth, range) float32 956kB ...
│           KDP                (azimuth, range) float32 956kB ...
│           PHIDP              (azimuth, range) float32 956kB ...
│           RHOHV              (azimuth, range) float32 956kB ...
│           DB_HCLASS          (azimuth, range) int16 478kB ...
│           sweep_mode         <U20 80B ...
│           sweep_number       int64 8B ...
│           prt_mode           <U7 28B ...
│           follow_mode        <U7 28B ...
│           sweep_fixed_angle  float64 8B ...
├── Group: /sweep_2
│       Dimensions:            (azimuth: 360, range: 664)
│       Coordinates:
│         * azimuth            (azimuth) float32 1kB 0.09064 0.9778 ... 358.0 359.1
│           elevation          (azimuth) float32 1kB ...
│           time               (azimuth) datetime64[ns] 3kB 2013-11-25T10:56:02.78100...
│         * range              (range) float32 3kB 300.0 750.0 ... 2.982e+05 2.986e+05
│       Data variables:
│           DBZH               (azimuth, range) float32 956kB ...
│           VRADH              (azimuth, range) float32 956kB ...
│           ZDR                (azimuth, range) float32 956kB ...
│           KDP                (azimuth, range) float32 956kB ...
│           PHIDP              (azimuth, range) float32 956kB ...
│           RHOHV              (azimuth, range) float32 956kB ...
│           DB_HCLASS          (azimuth, range) int16 478kB ...
│           sweep_mode         <U20 80B ...
│           sweep_number       int64 8B ...
│           prt_mode           <U7 28B ...
│           follow_mode        <U7 28B ...
│           sweep_fixed_angle  float64 8B ...
├── Group: /sweep_3
│       Dimensions:            (azimuth: 360, range: 664)
│       Coordinates:
│         * azimuth            (azimuth) float32 1kB 0.1401 0.986 2.016 ... 358.0 359.0
│           elevation          (azimuth) float32 1kB ...
│           time               (azimuth) datetime64[ns] 3kB 2013-11-25T10:56:27.05000...
│         * range              (range) float32 3kB 300.0 750.0 ... 2.982e+05 2.986e+05
│       Data variables:
│           DBZH               (azimuth, range) float32 956kB ...
│           VRADH              (azimuth, range) float32 956kB ...
│           ZDR                (azimuth, range) float32 956kB ...
│           KDP                (azimuth, range) float32 956kB ...
│           PHIDP              (azimuth, range) float32 956kB ...
│           RHOHV              (azimuth, range) float32 956kB ...
│           DB_HCLASS          (azimuth, range) int16 478kB ...
│           sweep_mode         <U20 80B ...
│           sweep_number       int64 8B ...
│           prt_mode           <U7 28B ...
│           follow_mode        <U7 28B ...
│           sweep_fixed_angle  float64 8B ...
├── Group: /sweep_4
│       Dimensions:            (azimuth: 360, range: 664)
│       Coordinates:
│         * azimuth            (azimuth) float32 1kB 0.09613 1.057 2.038 ... 358.1 359.0
│           elevation          (azimuth) float32 1kB ...
│           time               (azimuth) datetime64[ns] 3kB 2013-11-25T10:56:51.12400...
│         * range              (range) float32 3kB 300.0 750.0 ... 2.982e+05 2.986e+05
│       Data variables:
│           DBZH               (azimuth, range) float32 956kB ...
│           VRADH              (azimuth, range) float32 956kB ...
│           ZDR                (azimuth, range) float32 956kB ...
│           KDP                (azimuth, range) float32 956kB ...
│           PHIDP              (azimuth, range) float32 956kB ...
│           RHOHV              (azimuth, range) float32 956kB ...
│           DB_HCLASS          (azimuth, range) int16 478kB ...
│           sweep_mode         <U20 80B ...
│           sweep_number       int64 8B ...
│           prt_mode           <U7 28B ...
│           follow_mode        <U7 28B ...
│           sweep_fixed_angle  float64 8B ...
├── Group: /sweep_5
│       Dimensions:            (azimuth: 360, range: 664)
│       Coordinates:
│         * azimuth            (azimuth) float32 1kB 0.1126 1.016 2.098 ... 358.1 358.9
│           elevation          (azimuth) float32 1kB ...
│           time               (azimuth) datetime64[ns] 3kB 2013-11-25T10:57:15.29000...
│         * range              (range) float32 3kB 300.0 750.0 ... 2.982e+05 2.986e+05
│       Data variables:
│           DBZH               (azimuth, range) float32 956kB ...
│           VRADH              (azimuth, range) float32 956kB ...
│           ZDR                (azimuth, range) float32 956kB ...
│           KDP                (azimuth, range) float32 956kB ...
│           PHIDP              (azimuth, range) float32 956kB ...
│           RHOHV              (azimuth, range) float32 956kB ...
│           DB_HCLASS          (azimuth, range) int16 478kB ...
│           sweep_mode         <U20 80B ...
│           sweep_number       int64 8B ...
│           prt_mode           <U7 28B ...
│           follow_mode        <U7 28B ...
│           sweep_fixed_angle  float64 8B ...
├── Group: /sweep_6
│       Dimensions:            (azimuth: 360, range: 664)
│       Coordinates:
│         * azimuth            (azimuth) float32 1kB 0.0769 0.997 2.065 ... 358.1 359.0
│           elevation          (azimuth) float32 1kB ...
│           time               (azimuth) datetime64[ns] 3kB 2013-11-25T10:58:03.57000...
│         * range              (range) float32 3kB 300.0 750.0 ... 2.982e+05 2.986e+05
│       Data variables:
│           DBZH               (azimuth, range) float32 956kB ...
│           VRADH              (azimuth, range) float32 956kB ...
│           ZDR                (azimuth, range) float32 956kB ...
│           KDP                (azimuth, range) float32 956kB ...
│           PHIDP              (azimuth, range) float32 956kB ...
│           RHOHV              (azimuth, range) float32 956kB ...
│           DB_HCLASS          (azimuth, range) int16 478kB ...
│           sweep_mode         <U20 80B ...
│           sweep_number       int64 8B ...
│           prt_mode           <U7 28B ...
│           follow_mode        <U7 28B ...
│           sweep_fixed_angle  float64 8B ...
├── Group: /sweep_7
│       Dimensions:            (azimuth: 360, range: 664)
│       Coordinates:
│         * azimuth            (azimuth) float32 1kB 0.07965 1.016 2.019 ... 358.0 359.0
│           elevation          (azimuth) float32 1kB ...
│           time               (azimuth) datetime64[ns] 3kB 2013-11-25T10:58:27.00200...
│         * range              (range) float32 3kB 300.0 750.0 ... 2.982e+05 2.986e+05
│       Data variables:
│           DBZH               (azimuth, range) float32 956kB ...
│           VRADH              (azimuth, range) float32 956kB ...
│           ZDR                (azimuth, range) float32 956kB ...
│           KDP                (azimuth, range) float32 956kB ...
│           PHIDP              (azimuth, range) float32 956kB ...
│           RHOHV              (azimuth, range) float32 956kB ...
│           DB_HCLASS          (azimuth, range) int16 478kB ...
│           sweep_mode         <U20 80B ...
│           sweep_number       int64 8B ...
│           prt_mode           <U7 28B ...
│           follow_mode        <U7 28B ...
│           sweep_fixed_angle  float64 8B ...
├── Group: /sweep_8
│       Dimensions:            (azimuth: 360, range: 664)
│       Coordinates:
│         * azimuth            (azimuth) float32 1kB 0.06042 1.079 2.008 ... 358.0 359.1
│           elevation          (azimuth) float32 1kB ...
│           time               (azimuth) datetime64[ns] 3kB 2013-11-25T10:58:51.47000...
│         * range              (range) float32 3kB 300.0 750.0 ... 2.982e+05 2.986e+05
│       Data variables:
│           DBZH               (azimuth, range) float32 956kB ...
│           VRADH              (azimuth, range) float32 956kB ...
│           ZDR                (azimuth, range) float32 956kB ...
│           KDP                (azimuth, range) float32 956kB ...
│           PHIDP              (azimuth, range) float32 956kB ...
│           RHOHV              (azimuth, range) float32 956kB ...
│           DB_HCLASS          (azimuth, range) int16 478kB ...
│           sweep_mode         <U20 80B ...
│           sweep_number       int64 8B ...
│           prt_mode           <U7 28B ...
│           follow_mode        <U7 28B ...
│           sweep_fixed_angle  float64 8B ...
└── Group: /sweep_9
        Dimensions:            (azimuth: 360, range: 664)
        Coordinates:
          * azimuth            (azimuth) float32 1kB 1.134 1.986 3.062 ... 359.0 360.0
            elevation          (azimuth) float32 1kB ...
            time               (azimuth) datetime64[ns] 3kB 2013-11-25T10:59:15.49400...
          * range              (range) float32 3kB 300.0 750.0 ... 2.982e+05 2.986e+05
        Data variables:
            DBZH               (azimuth, range) float32 956kB ...
            VRADH              (azimuth, range) float32 956kB ...
            ZDR                (azimuth, range) float32 956kB ...
            KDP                (azimuth, range) float32 956kB ...
            PHIDP              (azimuth, range) float32 956kB ...
            RHOHV              (azimuth, range) float32 956kB ...
            DB_HCLASS          (azimuth, range) int16 478kB ...
            sweep_mode         <U20 80B ...
            sweep_number       int64 8B ...
            prt_mode           <U7 28B ...
            follow_mode        <U7 28B ...
sweep_fixed_angle float64 8B ...dtree = xd.io.open_iris_datatree(filename_volume, sweep="sweep_8")
display(dtree)
<xarray.DataTree>
Group: /
│   Dimensions:              (sweep: 1)
│   Coordinates:
│       latitude             float64 8B ...
│       longitude            float64 8B ...
│       altitude             float64 8B ...
│   Dimensions without coordinates: sweep
│   Data variables:
│       volume_number        int64 8B 0
│       platform_type        <U5 20B 'fixed'
│       instrument_type      <U5 20B 'radar'
│       time_coverage_start  <U20 80B '2013-11-25T10:58:33Z'
│       time_coverage_end    <U20 80B '2013-11-25T10:58:57Z'
│       sweep_group_name     (sweep) int64 8B 8
│       sweep_fixed_angle    (sweep) float64 8B 20.0
│   Attributes:
│       Conventions:      None
│       instrument_name:  Corozal, Radar
│       version:          None
│       title:            None
│       institution:      None
│       references:       None
│       source:           Sigmet
│       history:          None
│       comment:          AEROCIVIL OPERATIONAL DUAL POLE SCAN
│       scan_name:        SURV_HV_300
└── Group: /sweep_0
        Dimensions:            (azimuth: 360, range: 664)
        Coordinates:
          * azimuth            (azimuth) float32 1kB 0.06042 1.079 2.008 ... 358.0 359.1
            elevation          (azimuth) float32 1kB ...
            time               (azimuth) datetime64[ns] 3kB 2013-11-25T10:58:51.47000...
          * range              (range) float32 3kB 300.0 750.0 ... 2.982e+05 2.986e+05
        Data variables:
            DBZH               (azimuth, range) float32 956kB ...
            VRADH              (azimuth, range) float32 956kB ...
            ZDR                (azimuth, range) float32 956kB ...
            KDP                (azimuth, range) float32 956kB ...
            PHIDP              (azimuth, range) float32 956kB ...
            RHOHV              (azimuth, range) float32 956kB ...
            DB_HCLASS          (azimuth, range) int16 478kB ...
            sweep_mode         <U20 80B ...
            sweep_number       int64 8B ...
            prt_mode           <U7 28B ...
            follow_mode        <U7 28B ...
sweep_fixed_angle float64 8B ...dtree = xd.io.open_iris_datatree(filename_volume, sweep=[1, 2, 8])
display(dtree)
<xarray.DataTree>
Group: /
│   Dimensions:              (sweep: 3)
│   Coordinates:
│       latitude             float64 8B ...
│       longitude            float64 8B ...
│       altitude             float64 8B ...
│   Dimensions without coordinates: sweep
│   Data variables:
│       volume_number        int64 8B 0
│       platform_type        <U5 20B 'fixed'
│       instrument_type      <U5 20B 'radar'
│       time_coverage_start  <U20 80B '2013-11-25T10:55:30Z'
│       time_coverage_end    <U20 80B '2013-11-25T10:58:57Z'
│       sweep_group_name     (sweep) int64 24B 1 2 8
│       sweep_fixed_angle    (sweep) float64 24B 1.0 2.0 20.0
│   Attributes:
│       Conventions:      None
│       instrument_name:  Corozal, Radar
│       version:          None
│       title:            None
│       institution:      None
│       references:       None
│       source:           Sigmet
│       history:          None
│       comment:          AEROCIVIL OPERATIONAL DUAL POLE SCAN
│       scan_name:        SURV_HV_300
├── Group: /sweep_0
│       Dimensions:            (azimuth: 360, range: 664)
│       Coordinates:
│         * azimuth            (azimuth) float32 1kB 0.06042 1.016 2.054 ... 358.0 359.0
│           elevation          (azimuth) float32 1kB ...
│           time               (azimuth) datetime64[ns] 3kB 2013-11-25T10:55:38.62000...
│         * range              (range) float32 3kB 300.0 750.0 ... 2.982e+05 2.986e+05
│       Data variables:
│           DBZH               (azimuth, range) float32 956kB ...
│           VRADH              (azimuth, range) float32 956kB ...
│           ZDR                (azimuth, range) float32 956kB ...
│           KDP                (azimuth, range) float32 956kB ...
│           PHIDP              (azimuth, range) float32 956kB ...
│           RHOHV              (azimuth, range) float32 956kB ...
│           DB_HCLASS          (azimuth, range) int16 478kB ...
│           sweep_mode         <U20 80B ...
│           sweep_number       int64 8B ...
│           prt_mode           <U7 28B ...
│           follow_mode        <U7 28B ...
│           sweep_fixed_angle  float64 8B ...
├── Group: /sweep_1
│       Dimensions:            (azimuth: 360, range: 664)
│       Coordinates:
│         * azimuth            (azimuth) float32 1kB 0.09064 0.9778 ... 358.0 359.1
│           elevation          (azimuth) float32 1kB ...
│           time               (azimuth) datetime64[ns] 3kB 2013-11-25T10:56:02.78100...
│         * range              (range) float32 3kB 300.0 750.0 ... 2.982e+05 2.986e+05
│       Data variables:
│           DBZH               (azimuth, range) float32 956kB ...
│           VRADH              (azimuth, range) float32 956kB ...
│           ZDR                (azimuth, range) float32 956kB ...
│           KDP                (azimuth, range) float32 956kB ...
│           PHIDP              (azimuth, range) float32 956kB ...
│           RHOHV              (azimuth, range) float32 956kB ...
│           DB_HCLASS          (azimuth, range) int16 478kB ...
│           sweep_mode         <U20 80B ...
│           sweep_number       int64 8B ...
│           prt_mode           <U7 28B ...
│           follow_mode        <U7 28B ...
│           sweep_fixed_angle  float64 8B ...
└── Group: /sweep_2
        Dimensions:            (azimuth: 360, range: 664)
        Coordinates:
          * azimuth            (azimuth) float32 1kB 0.06042 1.079 2.008 ... 358.0 359.1
            elevation          (azimuth) float32 1kB ...
            time               (azimuth) datetime64[ns] 3kB 2013-11-25T10:58:51.47000...
          * range              (range) float32 3kB 300.0 750.0 ... 2.982e+05 2.986e+05
        Data variables:
            DBZH               (azimuth, range) float32 956kB ...
            VRADH              (azimuth, range) float32 956kB ...
            ZDR                (azimuth, range) float32 956kB ...
            KDP                (azimuth, range) float32 956kB ...
            PHIDP              (azimuth, range) float32 956kB ...
            RHOHV              (azimuth, range) float32 956kB ...
            DB_HCLASS          (azimuth, range) int16 478kB ...
            sweep_mode         <U20 80B ...
            sweep_number       int64 8B ...
            prt_mode           <U7 28B ...
            follow_mode        <U7 28B ...
sweep_fixed_angle float64 8B ...dtree = xd.io.open_iris_datatree(
filename_volume,
sweep=["sweep_0", "sweep_1", "sweep_8"],
)
display(dtree)
<xarray.DataTree>
Group: /
│   Dimensions:              (sweep: 3)
│   Coordinates:
│       latitude             float64 8B ...
│       longitude            float64 8B ...
│       altitude             float64 8B ...
│   Dimensions without coordinates: sweep
│   Data variables:
│       volume_number        int64 8B 0
│       platform_type        <U5 20B 'fixed'
│       instrument_type      <U5 20B 'radar'
│       time_coverage_start  <U20 80B '2013-11-25T10:55:04Z'
│       time_coverage_end    <U20 80B '2013-11-25T10:58:57Z'
│       sweep_group_name     (sweep) int64 24B 0 1 8
│       sweep_fixed_angle    (sweep) float64 24B 0.5 1.0 20.0
│   Attributes:
│       Conventions:      None
│       instrument_name:  Corozal, Radar
│       version:          None
│       title:            None
│       institution:      None
│       references:       None
│       source:           Sigmet
│       history:          None
│       comment:          AEROCIVIL OPERATIONAL DUAL POLE SCAN
│       scan_name:        SURV_HV_300
├── Group: /sweep_0
│       Dimensions:            (azimuth: 360, range: 664)
│       Coordinates:
│         * azimuth            (azimuth) float32 1kB 0.02197 1.134 2.09 ... 358.0 359.0
│           elevation          (azimuth) float32 1kB ...
│           time               (azimuth) datetime64[ns] 3kB 2013-11-25T10:55:14.54100...
│         * range              (range) float32 3kB 300.0 750.0 ... 2.982e+05 2.986e+05
│       Data variables:
│           DBZH               (azimuth, range) float32 956kB ...
│           VRADH              (azimuth, range) float32 956kB ...
│           ZDR                (azimuth, range) float32 956kB ...
│           KDP                (azimuth, range) float32 956kB ...
│           PHIDP              (azimuth, range) float32 956kB ...
│           RHOHV              (azimuth, range) float32 956kB ...
│           DB_HCLASS          (azimuth, range) int16 478kB ...
│           sweep_mode         <U20 80B ...
│           sweep_number       int64 8B ...
│           prt_mode           <U7 28B ...
│           follow_mode        <U7 28B ...
│           sweep_fixed_angle  float64 8B ...
├── Group: /sweep_1
│       Dimensions:            (azimuth: 360, range: 664)
│       Coordinates:
│         * azimuth            (azimuth) float32 1kB 0.06042 1.016 2.054 ... 358.0 359.0
│           elevation          (azimuth) float32 1kB ...
│           time               (azimuth) datetime64[ns] 3kB 2013-11-25T10:55:38.62000...
│         * range              (range) float32 3kB 300.0 750.0 ... 2.982e+05 2.986e+05
│       Data variables:
│           DBZH               (azimuth, range) float32 956kB ...
│           VRADH              (azimuth, range) float32 956kB ...
│           ZDR                (azimuth, range) float32 956kB ...
│           KDP                (azimuth, range) float32 956kB ...
│           PHIDP              (azimuth, range) float32 956kB ...
│           RHOHV              (azimuth, range) float32 956kB ...
│           DB_HCLASS          (azimuth, range) int16 478kB ...
│           sweep_mode         <U20 80B ...
│           sweep_number       int64 8B ...
│           prt_mode           <U7 28B ...
│           follow_mode        <U7 28B ...
│           sweep_fixed_angle  float64 8B ...
└── Group: /sweep_2
        Dimensions:            (azimuth: 360, range: 664)
        Coordinates:
          * azimuth            (azimuth) float32 1kB 0.06042 1.079 2.008 ... 358.0 359.1
            elevation          (azimuth) float32 1kB ...
            time               (azimuth) datetime64[ns] 3kB 2013-11-25T10:58:51.47000...
          * range              (range) float32 3kB 300.0 750.0 ... 2.982e+05 2.986e+05
        Data variables:
            DBZH               (azimuth, range) float32 956kB ...
            VRADH              (azimuth, range) float32 956kB ...
            ZDR                (azimuth, range) float32 956kB ...
            KDP                (azimuth, range) float32 956kB ...
            PHIDP              (azimuth, range) float32 956kB ...
            RHOHV              (azimuth, range) float32 956kB ...
            DB_HCLASS          (azimuth, range) int16 478kB ...
            sweep_mode         <U20 80B ...
            sweep_number       int64 8B ...
            prt_mode           <U7 28B ...
            follow_mode        <U7 28B ...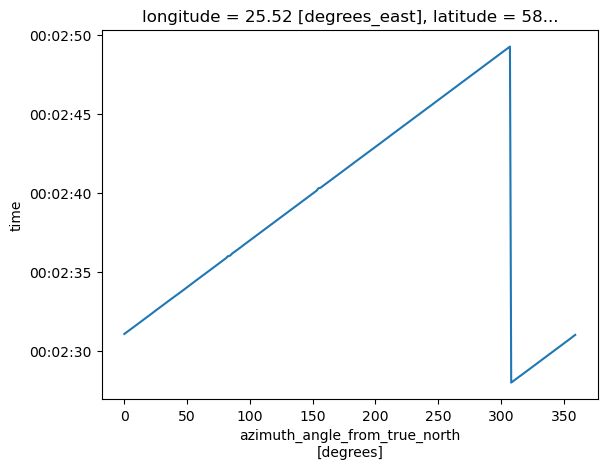
sweep_fixed_angle float64 8B ...Plot Time vs. Azimuth#
dtree["sweep_0"].ds.azimuth.plot(y="time")
[<matplotlib.lines.Line2D at 0x703e66f19d10>]
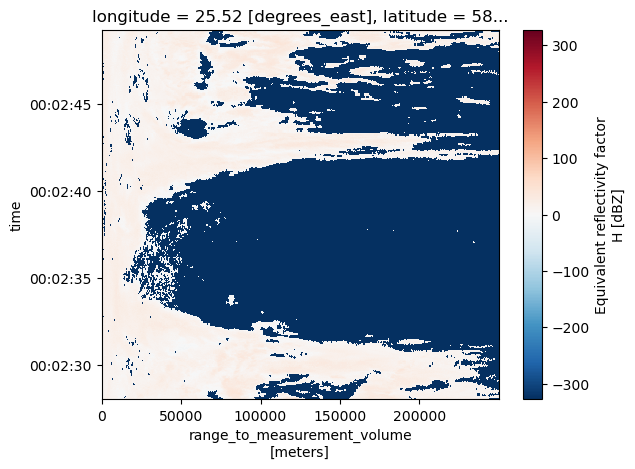
Plot Sweep Range vs. Time#
We need to sort by time and specify the y-coordinate. Please also observe the different resolutions of this plot, compared to the Azimuth vs. Range plot below. This is due to second-resolution of the time coordinate.
dtree["sweep_0"].ds.DBZH.sortby("time").plot(y="time")
<matplotlib.collections.QuadMesh at 0x703e66f7f4d0>
Plot Sweep Range vs. Azimuth#
dtree["sweep_0"].ds.DBZH.plot()
<matplotlib.collections.QuadMesh at 0x703e66e3d950>
import matplotlib.pyplot as plt
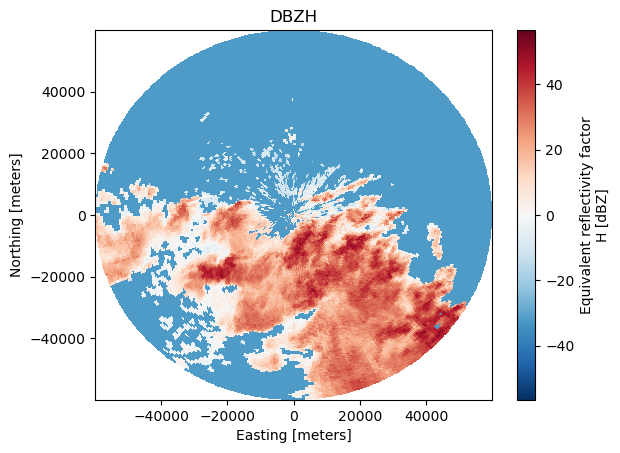
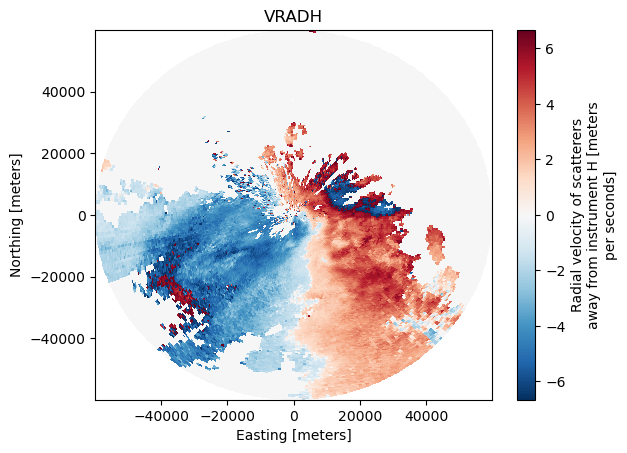
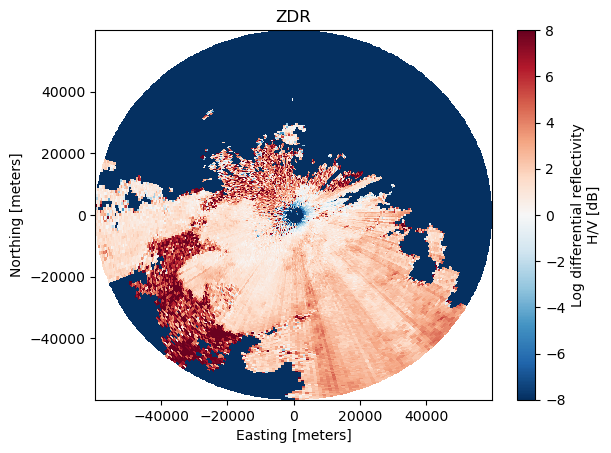
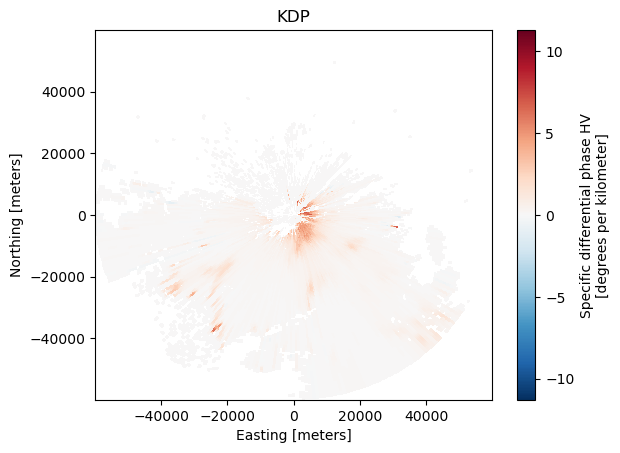
sweep = dtree["sweep_0"].to_dataset(inherit="all_coords")
sweep = sweep.sel(range=slice(0, 60000))
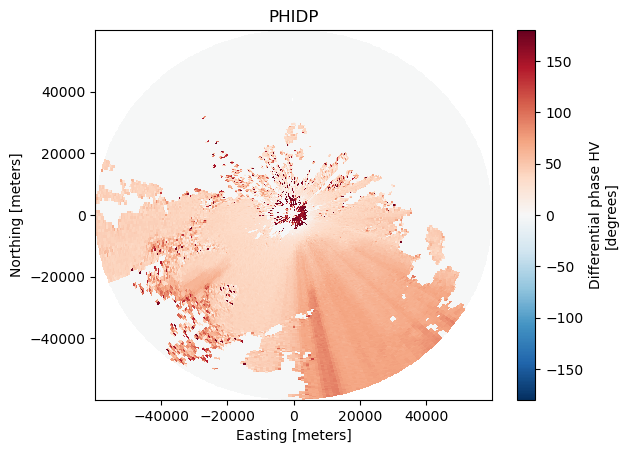
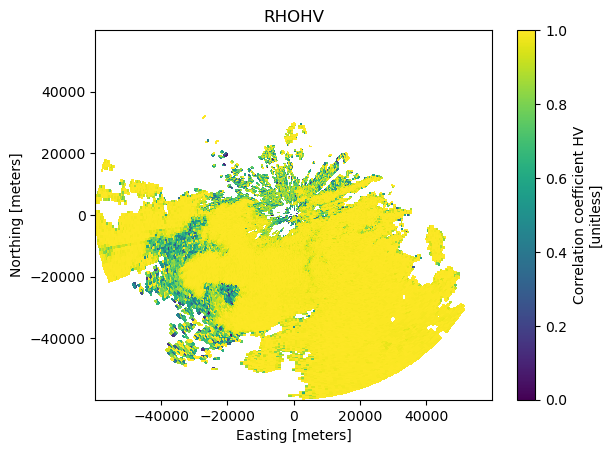
sweep = xd.georeference.get_x_y_z(sweep)
for var in xd.util.get_sweep_dataset_vars(sweep):
plt.figure()
sweep[var].plot(x="x", y="y")
plt.title(var)
/home/docs/checkouts/readthedocs.org/user_builds/xradar/conda/stable/lib/python3.13/site-packages/xradar/io/backends/iris.py:254: RuntimeWarning: invalid value encountered in sqrt
  return np.sqrt(decode_array(data, **kwargs))