CfRadial1 - Export#
Imports#
import cmweather  # noqa
import xarray as xr
from open_radar_data import DATASETS

import xradar as xd
Download#
Fetching CfRadial1 radar data file from open-radar-data repository.
filename = DATASETS.fetch("cfrad.20080604_002217_000_SPOL_v36_SUR.nc")
radar = xd.io.open_cfradial1_datatree(filename, first_dim="auto")
display(radar)
<xarray.DataTree>
Group: /
│   Dimensions:              (sweep: 9)
│   Coordinates:
│       latitude             float64 8B ...
│       longitude            float64 8B ...
│       altitude             float64 8B ...
│   Dimensions without coordinates: sweep
│   Data variables:
│       volume_number        int32 4B ...
│       platform_type        |S32 32B ...
│       primary_axis         |S32 32B ...
│       status_str           |S1 1B ...
│       instrument_type      |S32 32B ...
│       time_coverage_start  |S32 32B ...
│       time_coverage_end    |S32 32B ...
│       sweep_group_name     (sweep) <U7 252B 'sweep_0' 'sweep_1' ... 'sweep_8'
│       sweep_fixed_angle    (sweep) float32 36B ...
│   Attributes: (12/13)
│       Conventions:         CF/Radial instrument_parameters radar_parameters rad...
│       version:             1.2
│       title:               TIMREX
│       institution:
│       references:
│       source:
│       ...                  ...
│       comment:
│       instrument_name:     SPOLRVP8
│       site_name:
│       scan_name:
│       scan_id:             0
│       platform_is_mobile:  false
├── Group: /sweep_0
│       Dimensions:                    (azimuth: 483, range: 996)
│       Coordinates:
│         * azimuth                    (azimuth) float32 2kB 0.0 0.75 ... 358.5 359.2
│           elevation                  (azimuth) float32 2kB ...
│           time                       (azimuth) datetime64[ns] 4kB 2008-06-04T00:15:...
│         * range                      (range) float32 4kB 150.0 300.0 ... 1.494e+05
│       Data variables: (12/18)
│           sweep_number               int32 4B ...
│           sweep_mode                 <U20 80B 'azimuth_surveillance'
│           prt_mode                   |S32 32B ...
│           follow_mode                |S32 32B ...
│           sweep_fixed_angle          float32 4B ...
│           pulse_width                (azimuth) float32 2kB ...
│           ...                         ...
│           r_calib_index              (azimuth) int8 483B ...
│           measured_transmit_power_h  (azimuth) float32 2kB ...
│           measured_transmit_power_v  (azimuth) float32 2kB ...
│           scan_rate                  (azimuth) float32 2kB ...
│           DBZ                        (azimuth, range) float32 2MB ...
│           VR                         (azimuth, range) float32 2MB ...
├── Group: /sweep_1
│       Dimensions:                    (azimuth: 483, range: 996)
│       Coordinates:
│         * azimuth                    (azimuth) float32 2kB 0.0 0.75 ... 358.5 359.2
│           elevation                  (azimuth) float32 2kB ...
│           time                       (azimuth) datetime64[ns] 4kB 2008-06-04T00:16:...
│         * range                      (range) float32 4kB 150.0 300.0 ... 1.494e+05
│       Data variables: (12/18)
│           sweep_number               int32 4B ...
│           sweep_mode                 <U20 80B 'azimuth_surveillance'
│           prt_mode                   |S32 32B ...
│           follow_mode                |S32 32B ...
│           sweep_fixed_angle          float32 4B ...
│           pulse_width                (azimuth) float32 2kB ...
│           ...                         ...
│           r_calib_index              (azimuth) int8 483B ...
│           measured_transmit_power_h  (azimuth) float32 2kB ...
│           measured_transmit_power_v  (azimuth) float32 2kB ...
│           scan_rate                  (azimuth) float32 2kB ...
│           DBZ                        (azimuth, range) float32 2MB ...
│           VR                         (azimuth, range) float32 2MB ...
├── Group: /sweep_2
│       Dimensions:                    (azimuth: 482, range: 996)
│       Coordinates:
│         * azimuth                    (azimuth) float32 2kB 0.0 0.75 ... 358.5 359.2
│           elevation                  (azimuth) float32 2kB ...
│           time                       (azimuth) datetime64[ns] 4kB 2008-06-04T00:17:...
│         * range                      (range) float32 4kB 150.0 300.0 ... 1.494e+05
│       Data variables: (12/18)
│           sweep_number               int32 4B ...
│           sweep_mode                 <U20 80B 'azimuth_surveillance'
│           prt_mode                   |S32 32B ...
│           follow_mode                |S32 32B ...
│           sweep_fixed_angle          float32 4B ...
│           pulse_width                (azimuth) float32 2kB ...
│           ...                         ...
│           r_calib_index              (azimuth) int8 482B ...
│           measured_transmit_power_h  (azimuth) float32 2kB ...
│           measured_transmit_power_v  (azimuth) float32 2kB ...
│           scan_rate                  (azimuth) float32 2kB ...
│           DBZ                        (azimuth, range) float32 2MB ...
│           VR                         (azimuth, range) float32 2MB ...
├── Group: /sweep_3
│       Dimensions:                    (azimuth: 483, range: 996)
│       Coordinates:
│         * azimuth                    (azimuth) float32 2kB 0.0 0.75 ... 358.5 359.2
│           elevation                  (azimuth) float32 2kB ...
│           time                       (azimuth) datetime64[ns] 4kB 2008-06-04T00:17:...
│         * range                      (range) float32 4kB 150.0 300.0 ... 1.494e+05
│       Data variables: (12/18)
│           sweep_number               int32 4B ...
│           sweep_mode                 <U20 80B 'azimuth_surveillance'
│           prt_mode                   |S32 32B ...
│           follow_mode                |S32 32B ...
│           sweep_fixed_angle          float32 4B ...
│           pulse_width                (azimuth) float32 2kB ...
│           ...                         ...
│           r_calib_index              (azimuth) int8 483B ...
│           measured_transmit_power_h  (azimuth) float32 2kB ...
│           measured_transmit_power_v  (azimuth) float32 2kB ...
│           scan_rate                  (azimuth) float32 2kB ...
│           DBZ                        (azimuth, range) float32 2MB ...
│           VR                         (azimuth, range) float32 2MB ...
├── Group: /sweep_4
│       Dimensions:                    (azimuth: 481, range: 996)
│       Coordinates:
│         * azimuth                    (azimuth) float32 2kB 0.0 0.75 ... 358.5 359.2
│           elevation                  (azimuth) float32 2kB ...
│           time                       (azimuth) datetime64[ns] 4kB 2008-06-04T00:18:...
│         * range                      (range) float32 4kB 150.0 300.0 ... 1.494e+05
│       Data variables: (12/18)
│           sweep_number               int32 4B ...
│           sweep_mode                 <U20 80B 'azimuth_surveillance'
│           prt_mode                   |S32 32B ...
│           follow_mode                |S32 32B ...
│           sweep_fixed_angle          float32 4B ...
│           pulse_width                (azimuth) float32 2kB ...
│           ...                         ...
│           r_calib_index              (azimuth) int8 481B ...
│           measured_transmit_power_h  (azimuth) float32 2kB ...
│           measured_transmit_power_v  (azimuth) float32 2kB ...
│           scan_rate                  (azimuth) float32 2kB ...
│           DBZ                        (azimuth, range) float32 2MB ...
│           VR                         (azimuth, range) float32 2MB ...
├── Group: /sweep_5
│       Dimensions:                    (azimuth: 482, range: 996)
│       Coordinates:
│         * azimuth                    (azimuth) float32 2kB 0.0 0.75 ... 358.5 359.2
│           elevation                  (azimuth) float32 2kB ...
│           time                       (azimuth) datetime64[ns] 4kB 2008-06-04T00:19:...
│         * range                      (range) float32 4kB 150.0 300.0 ... 1.494e+05
│       Data variables: (12/18)
│           sweep_number               int32 4B ...
│           sweep_mode                 <U20 80B 'azimuth_surveillance'
│           prt_mode                   |S32 32B ...
│           follow_mode                |S32 32B ...
│           sweep_fixed_angle          float32 4B ...
│           pulse_width                (azimuth) float32 2kB ...
│           ...                         ...
│           r_calib_index              (azimuth) int8 482B ...
│           measured_transmit_power_h  (azimuth) float32 2kB ...
│           measured_transmit_power_v  (azimuth) float32 2kB ...
│           scan_rate                  (azimuth) float32 2kB ...
│           DBZ                        (azimuth, range) float32 2MB ...
│           VR                         (azimuth, range) float32 2MB ...
├── Group: /sweep_6
│       Dimensions:                    (azimuth: 482, range: 996)
│       Coordinates:
│         * azimuth                    (azimuth) float32 2kB 0.0 0.75 ... 358.5 359.2
│           elevation                  (azimuth) float32 2kB ...
│           time                       (azimuth) datetime64[ns] 4kB 2008-06-04T00:20:...
│         * range                      (range) float32 4kB 150.0 300.0 ... 1.494e+05
│       Data variables: (12/18)
│           sweep_number               int32 4B ...
│           sweep_mode                 <U20 80B 'azimuth_surveillance'
│           prt_mode                   |S32 32B ...
│           follow_mode                |S32 32B ...
│           sweep_fixed_angle          float32 4B ...
│           pulse_width                (azimuth) float32 2kB ...
│           ...                         ...
│           r_calib_index              (azimuth) int8 482B ...
│           measured_transmit_power_h  (azimuth) float32 2kB ...
│           measured_transmit_power_v  (azimuth) float32 2kB ...
│           scan_rate                  (azimuth) float32 2kB ...
│           DBZ                        (azimuth, range) float32 2MB ...
│           VR                         (azimuth, range) float32 2MB ...
├── Group: /sweep_7
│       Dimensions:                    (azimuth: 484, range: 996)
│       Coordinates:
│         * azimuth                    (azimuth) float32 2kB 0.0 0.75 ... 358.5 359.2
│           elevation                  (azimuth) float32 2kB ...
│           time                       (azimuth) datetime64[ns] 4kB 2008-06-04T00:21:...
│         * range                      (range) float32 4kB 150.0 300.0 ... 1.494e+05
│       Data variables: (12/18)
│           sweep_number               int32 4B ...
│           sweep_mode                 <U20 80B 'azimuth_surveillance'
│           prt_mode                   |S32 32B ...
│           follow_mode                |S32 32B ...
│           sweep_fixed_angle          float32 4B ...
│           pulse_width                (azimuth) float32 2kB ...
│           ...                         ...
│           r_calib_index              (azimuth) int8 484B ...
│           measured_transmit_power_h  (azimuth) float32 2kB ...
│           measured_transmit_power_v  (azimuth) float32 2kB ...
│           scan_rate                  (azimuth) float32 2kB ...
│           DBZ                        (azimuth, range) float32 2MB ...
│           VR                         (azimuth, range) float32 2MB ...
└── Group: /sweep_8
        Dimensions:                    (azimuth: 483, range: 996)
        Coordinates:
          * azimuth                    (azimuth) float32 2kB 0.0 0.75 ... 358.5 359.2
            elevation                  (azimuth) float32 2kB ...
            time                       (azimuth) datetime64[ns] 4kB 2008-06-04T00:21:...
          * range                      (range) float32 4kB 150.0 300.0 ... 1.494e+05
        Data variables: (12/18)
            sweep_number               int32 4B ...
            sweep_mode                 <U20 80B 'azimuth_surveillance'
            prt_mode                   |S32 32B ...
            follow_mode                |S32 32B ...
            sweep_fixed_angle          float32 4B ...
            pulse_width                (azimuth) float32 2kB ...
            ...                         ...
            r_calib_index              (azimuth) int8 483B ...
            measured_transmit_power_h  (azimuth) float32 2kB ...
            measured_transmit_power_v  (azimuth) float32 2kB ...
            scan_rate                  (azimuth) float32 2kB ...
            DBZ                        (azimuth, range) float32 2MB ...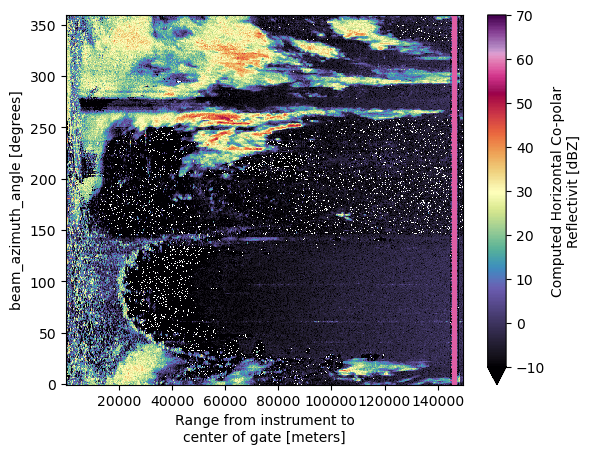
VR (azimuth, range) float32 2MB ...Plot Azimuth vs. Range#
radar.sweep_0.DBZ.plot(cmap="ChaseSpectral", vmin=-10, vmax=70)
<matplotlib.collections.QuadMesh at 0x72c1cc6bbe00>
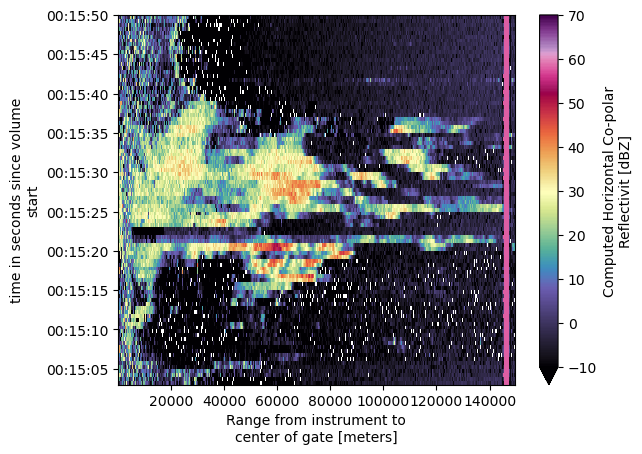
Plot Time vs. Range#
radar.sweep_0.DBZ.swap_dims({"azimuth": "time"}).sortby("time").plot(
    cmap="ChaseSpectral", vmin=-10, vmax=70
)
<matplotlib.collections.QuadMesh at 0x72c1cc5cec10>
Georeference#
radar = radar.xradar.georeference()
display(radar)
<xarray.DataTree>
Group: /
│ Dimensions: (sweep: 9)
│ Coordinates:
│ latitude float64 8B ...
│ longitude float64 8B ...
│ altitude float64 8B ...
│ Dimensions without coordinates: sweep
│ Data variables:
│ volume_number int32 4B ...
│ platform_type |S32 32B ...
│ primary_axis |S32 32B ...
│ status_str |S1 1B ...
│ instrument_type |S32 32B ...
│ time_coverage_start |S32 32B ...
│ time_coverage_end |S32 32B ...
│ sweep_group_name (sweep) <U7 252B 'sweep_0' 'sweep_1' ... 'sweep_8'
│ sweep_fixed_angle (sweep) float32 36B ...
│ Attributes: (12/13)
│ Conventions: CF/Radial instrument_parameters radar_parameters rad...
│ version: 1.2
│ title: TIMREX
│ institution:
│ references:
│ source:
│ ... ...
│ comment:
│ instrument_name: SPOLRVP8
│ site_name:
│ scan_name:
│ scan_id: 0
│ platform_is_mobile: false
├── Group: /sweep_0
│ Dimensions: (azimuth: 483, range: 996)
│ Coordinates:
│ * azimuth (azimuth) float32 2kB 0.0 0.75 ... 358.5 359.2
│ elevation (azimuth) float32 2kB 0.5164 0.5219 ... 0.5219
│ time (azimuth) datetime64[ns] 4kB 2008-06-04T00:15:...
│ * range (range) float32 4kB 150.0 300.0 ... 1.494e+05
│ x (azimuth, range) float64 4MB 0.0 ... -1.955e+03
│ y (azimuth, range) float64 4MB 150.0 ... 1.493e+05
│ z (azimuth, range) float64 4MB 46.35 ... 2.718e+03
│ latitude float64 8B 22.53
│ longitude float64 8B 120.4
│ altitude float64 8B 45.0
│ crs_wkt int64 8B 0
│ Data variables: (12/18)
│ sweep_number int32 4B ...
│ sweep_mode <U20 80B 'azimuth_surveillance'
│ prt_mode |S32 32B ...
│ follow_mode |S32 32B ...
│ sweep_fixed_angle float32 4B ...
│ pulse_width (azimuth) float32 2kB ...
│ ... ...
│ r_calib_index (azimuth) int8 483B ...
│ measured_transmit_power_h (azimuth) float32 2kB ...
│ measured_transmit_power_v (azimuth) float32 2kB ...
│ scan_rate (azimuth) float32 2kB ...
│ DBZ (azimuth, range) float32 2MB ...
│ VR (azimuth, range) float32 2MB ...
├── Group: /sweep_1
│ Dimensions: (azimuth: 483, range: 996)
│ Coordinates:
│ * azimuth (azimuth) float32 2kB 0.0 0.75 ... 358.5 359.2
│ elevation (azimuth) float32 2kB 1.104 1.104 ... 1.104 1.104
│ time (azimuth) datetime64[ns] 4kB 2008-06-04T00:16:...
│ * range (range) float32 4kB 150.0 300.0 ... 1.494e+05
│ x (azimuth, range) float64 4MB 0.0 ... -1.954e+03
│ y (azimuth, range) float64 4MB 150.0 ... 1.493e+05
│ z (azimuth, range) float64 4MB 47.89 ... 4.236e+03
│ latitude float64 8B 22.53
│ longitude float64 8B 120.4
│ altitude float64 8B 45.0
│ crs_wkt int64 8B 0
│ Data variables: (12/18)
│ sweep_number int32 4B ...
│ sweep_mode <U20 80B 'azimuth_surveillance'
│ prt_mode |S32 32B ...
│ follow_mode |S32 32B ...
│ sweep_fixed_angle float32 4B ...
│ pulse_width (azimuth) float32 2kB ...
│ ... ...
│ r_calib_index (azimuth) int8 483B ...
│ measured_transmit_power_h (azimuth) float32 2kB ...
│ measured_transmit_power_v (azimuth) float32 2kB ...
│ scan_rate (azimuth) float32 2kB ...
│ DBZ (azimuth, range) float32 2MB ...
│ VR (azimuth, range) float32 2MB ...
├── Group: /sweep_2
│ Dimensions: (azimuth: 482, range: 996)
│ Coordinates:
│ * azimuth (azimuth) float32 2kB 0.0 0.75 ... 358.5 359.2
│ elevation (azimuth) float32 2kB 1.796 1.796 ... 1.796 1.796
│ time (azimuth) datetime64[ns] 4kB 2008-06-04T00:17:...
│ * range (range) float32 4kB 150.0 300.0 ... 1.494e+05
│ x (azimuth, range) float64 4MB 0.0 ... -1.953e+03
│ y (azimuth, range) float64 4MB 149.9 ... 1.492e+05
│ z (azimuth, range) float64 4MB 49.7 ... 6.039e+03
│ latitude float64 8B 22.53
│ longitude float64 8B 120.4
│ altitude float64 8B 45.0
│ crs_wkt int64 8B 0
│ Data variables: (12/18)
│ sweep_number int32 4B ...
│ sweep_mode <U20 80B 'azimuth_surveillance'
│ prt_mode |S32 32B ...
│ follow_mode |S32 32B ...
│ sweep_fixed_angle float32 4B ...
│ pulse_width (azimuth) float32 2kB ...
│ ... ...
│ r_calib_index (azimuth) int8 482B ...
│ measured_transmit_power_h (azimuth) float32 2kB ...
│ measured_transmit_power_v (azimuth) float32 2kB ...
│ scan_rate (azimuth) float32 2kB ...
│ DBZ (azimuth, range) float32 2MB ...
│ VR (azimuth, range) float32 2MB ...
├── Group: /sweep_3
│ Dimensions: (azimuth: 483, range: 996)
│ Coordinates:
│ * azimuth (azimuth) float32 2kB 0.0 0.75 ... 358.5 359.2
│ elevation (azimuth) float32 2kB 2.598 2.598 ... 2.598 2.598
│ time (azimuth) datetime64[ns] 4kB 2008-06-04T00:17:...
│ * range (range) float32 4kB 150.0 300.0 ... 1.494e+05
│ x (azimuth, range) float64 4MB 0.0 ... -1.952e+03
│ y (azimuth, range) float64 4MB 149.8 ... 1.491e+05
│ z (azimuth, range) float64 4MB 51.8 ... 8.127e+03
│ latitude float64 8B 22.53
│ longitude float64 8B 120.4
│ altitude float64 8B 45.0
│ crs_wkt int64 8B 0
│ Data variables: (12/18)
│ sweep_number int32 4B ...
│ sweep_mode <U20 80B 'azimuth_surveillance'
│ prt_mode |S32 32B ...
│ follow_mode |S32 32B ...
│ sweep_fixed_angle float32 4B ...
│ pulse_width (azimuth) float32 2kB ...
│ ... ...
│ r_calib_index (azimuth) int8 483B ...
│ measured_transmit_power_h (azimuth) float32 2kB ...
│ measured_transmit_power_v (azimuth) float32 2kB ...
│ scan_rate (azimuth) float32 2kB ...
│ DBZ (azimuth, range) float32 2MB ...
│ VR (azimuth, range) float32 2MB ...
├── Group: /sweep_4
│ Dimensions: (azimuth: 481, range: 996)
│ Coordinates:
│ * azimuth (azimuth) float32 2kB 0.0 0.75 ... 358.5 359.2
│ elevation (azimuth) float32 2kB 3.598 3.598 ... 3.598 3.598
│ time (azimuth) datetime64[ns] 4kB 2008-06-04T00:18:...
│ * range (range) float32 4kB 150.0 300.0 ... 1.494e+05
│ x (azimuth, range) float64 4MB 0.0 ... -1.949e+03
│ y (azimuth, range) float64 4MB 149.7 ... 1.489e+05
│ z (azimuth, range) float64 4MB 54.41 ... 1.073e+04
│ latitude float64 8B 22.53
│ longitude float64 8B 120.4
│ altitude float64 8B 45.0
│ crs_wkt int64 8B 0
│ Data variables: (12/18)
│ sweep_number int32 4B ...
│ sweep_mode <U20 80B 'azimuth_surveillance'
│ prt_mode |S32 32B ...
│ follow_mode |S32 32B ...
│ sweep_fixed_angle float32 4B ...
│ pulse_width (azimuth) float32 2kB ...
│ ... ...
│ r_calib_index (azimuth) int8 481B ...
│ measured_transmit_power_h (azimuth) float32 2kB ...
│ measured_transmit_power_v (azimuth) float32 2kB ...
│ scan_rate (azimuth) float32 2kB ...
│ DBZ (azimuth, range) float32 2MB ...
│ VR (azimuth, range) float32 2MB ...
├── Group: /sweep_5
│ Dimensions: (azimuth: 482, range: 996)
│ Coordinates:
│ * azimuth (azimuth) float32 2kB 0.0 0.75 ... 358.5 359.2
│ elevation (azimuth) float32 2kB 4.708 4.708 ... 4.708 4.708
│ time (azimuth) datetime64[ns] 4kB 2008-06-04T00:19:...
│ * range (range) float32 4kB 150.0 300.0 ... 1.494e+05
│ x (azimuth, range) float64 4MB 0.0 ... -1.946e+03
│ y (azimuth, range) float64 4MB 149.5 ... 1.487e+05
│ z (azimuth, range) float64 4MB 57.31 ... 1.361e+04
│ latitude float64 8B 22.53
│ longitude float64 8B 120.4
│ altitude float64 8B 45.0
│ crs_wkt int64 8B 0
│ Data variables: (12/18)
│ sweep_number int32 4B ...
│ sweep_mode <U20 80B 'azimuth_surveillance'
│ prt_mode |S32 32B ...
│ follow_mode |S32 32B ...
│ sweep_fixed_angle float32 4B ...
│ pulse_width (azimuth) float32 2kB ...
│ ... ...
│ r_calib_index (azimuth) int8 482B ...
│ measured_transmit_power_h (azimuth) float32 2kB ...
│ measured_transmit_power_v (azimuth) float32 2kB ...
│ scan_rate (azimuth) float32 2kB ...
│ DBZ (azimuth, range) float32 2MB ...
│ VR (azimuth, range) float32 2MB ...
├── Group: /sweep_6
│ Dimensions: (azimuth: 482, range: 996)
│ Coordinates:
│ * azimuth (azimuth) float32 2kB 0.0 0.75 ... 358.5 359.2
│ elevation (azimuth) float32 2kB 6.471 6.471 ... 6.471 6.471
│ time (azimuth) datetime64[ns] 4kB 2008-06-04T00:20:...
│ * range (range) float32 4kB 150.0 300.0 ... 1.494e+05
│ x (azimuth, range) float64 4MB 0.0 ... -1.939e+03
│ y (azimuth, range) float64 4MB 149.0 ... 1.481e+05
│ z (azimuth, range) float64 4MB 61.91 ... 1.818e+04
│ latitude float64 8B 22.53
│ longitude float64 8B 120.4
│ altitude float64 8B 45.0
│ crs_wkt int64 8B 0
│ Data variables: (12/18)
│ sweep_number int32 4B ...
│ sweep_mode <U20 80B 'azimuth_surveillance'
│ prt_mode |S32 32B ...
│ follow_mode |S32 32B ...
│ sweep_fixed_angle float32 4B ...
│ pulse_width (azimuth) float32 2kB ...
│ ... ...
│ r_calib_index (azimuth) int8 482B ...
│ measured_transmit_power_h (azimuth) float32 2kB ...
│ measured_transmit_power_v (azimuth) float32 2kB ...
│ scan_rate (azimuth) float32 2kB ...
│ DBZ (azimuth, range) float32 2MB ...
│ VR (azimuth, range) float32 2MB ...
├── Group: /sweep_7
│ Dimensions: (azimuth: 484, range: 996)
│ Coordinates:
│ * azimuth (azimuth) float32 2kB 0.0 0.75 ... 358.5 359.2
│ elevation (azimuth) float32 2kB 9.102 9.102 ... 9.102 9.102
│ time (azimuth) datetime64[ns] 4kB 2008-06-04T00:21:...
│ * range (range) float32 4kB 150.0 300.0 ... 1.494e+05
│ x (azimuth, range) float64 4MB 0.0 ... -1.925e+03
│ y (azimuth, range) float64 4MB 148.1 ... 1.471e+05
│ z (azimuth, range) float64 4MB 68.73 ... 2.496e+04
│ latitude float64 8B 22.53
│ longitude float64 8B 120.4
│ altitude float64 8B 45.0
│ crs_wkt int64 8B 0
│ Data variables: (12/18)
│ sweep_number int32 4B ...
│ sweep_mode <U20 80B 'azimuth_surveillance'
│ prt_mode |S32 32B ...
│ follow_mode |S32 32B ...
│ sweep_fixed_angle float32 4B ...
│ pulse_width (azimuth) float32 2kB ...
│ ... ...
│ r_calib_index (azimuth) int8 484B ...
│ measured_transmit_power_h (azimuth) float32 2kB ...
│ measured_transmit_power_v (azimuth) float32 2kB ...
│ scan_rate (azimuth) float32 2kB ...
│ DBZ (azimuth, range) float32 2MB ...
│ VR (azimuth, range) float32 2MB ...
└── Group: /sweep_8
Dimensions: (azimuth: 483, range: 996)
Coordinates:
* azimuth (azimuth) float32 2kB 0.0 0.75 ... 358.5 359.2
elevation (azimuth) float32 2kB 12.8 12.8 ... 12.79 12.8
time (azimuth) datetime64[ns] 4kB 2008-06-04T00:21:...
* range (range) float32 4kB 150.0 300.0 ... 1.494e+05
x (azimuth, range) float64 4MB 0.0 ... -1.899e+03
y (azimuth, range) float64 4MB 146.3 ... 1.451e+05
z (azimuth, range) float64 4MB 78.23 ... 3.439e+04
latitude float64 8B 22.53
longitude float64 8B 120.4
altitude float64 8B 45.0
crs_wkt int64 8B 0
Data variables: (12/18)
sweep_number int32 4B ...
sweep_mode <U20 80B 'azimuth_surveillance'
prt_mode |S32 32B ...
follow_mode |S32 32B ...
sweep_fixed_angle float32 4B ...
pulse_width (azimuth) float32 2kB ...
... ...
r_calib_index (azimuth) int8 483B ...
measured_transmit_power_h (azimuth) float32 2kB ...
measured_transmit_power_v (azimuth) float32 2kB ...
scan_rate (azimuth) float32 2kB ...
DBZ (azimuth, range) float32 2MB ...
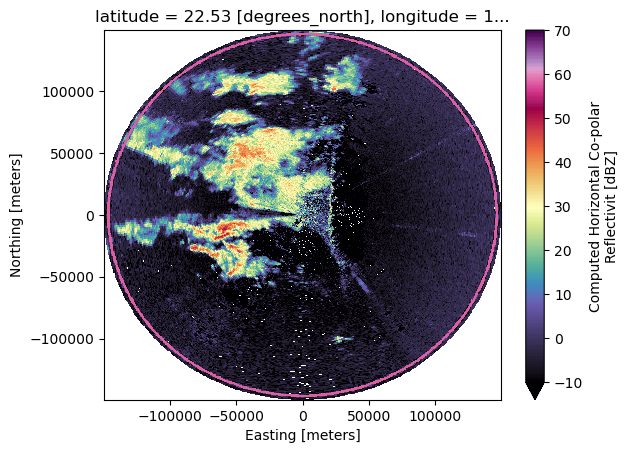
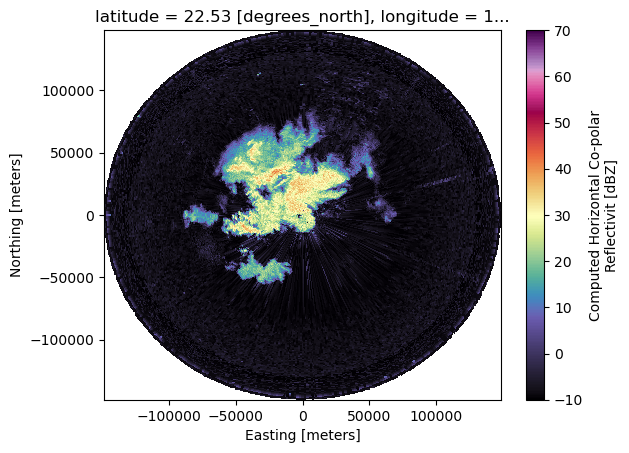
VR (azimuth, range) float32 2MB ...Plot PPI#
radar["sweep_0"]["DBZ"].plot(x="x", y="y", cmap="ChaseSpectral", vmin=-10, vmax=70)
<matplotlib.collections.QuadMesh at 0x72c1cc4e5950>
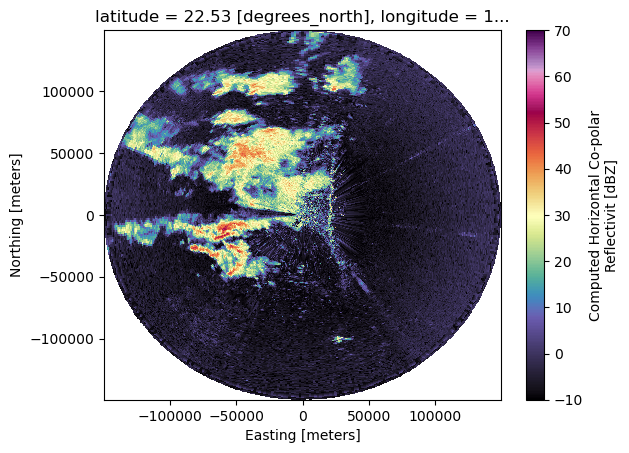
Filter#
Apply basic reflectivity filter. This is just a demonstration.
def ref_filter(dtree, sweep="sweep_0", field="DBZ"):
    ds = dtree[sweep].ds
    ds = ds.where((ds[field] >= -10) & (ds[field] <= 70))
    red_patch = ds.where(
        (
            (ds[field] >= ds[field].max().values - 0.5)
            & (ds[field] <= ds[field].max().values + 0.5)
        ),
        drop=True,
    )
    rmin, rmax = int(red_patch.range.min().values - 150), int(
        red_patch.range.max().values + 150
    )
    out_of_range_mask = (ds.range < rmin) | (ds.range > rmax)
    ds[field] = ds[field].where(out_of_range_mask)
    # Interpolate missing values using the slinear method along the 'range' dimension
    ds[field] = ds[field].interpolate_na(dim="range", method="slinear")
    dtree[sweep][f"corr_{field}"] = ds[field].copy()
    return dtree[sweep]
swp0 = ref_filter(radar, sweep="sweep_0", field="DBZ")
swp0.corr_DBZ.plot(x="x", y="y", cmap="ChaseSpectral", vmin=-10, vmax=70)
<matplotlib.collections.QuadMesh at 0x72c1cc3f2490>
Filter full volume#
# Initialize an empty DataTree
result_tree = xr.DataTree()

for sweep in radar.sweep_group_name.values:
    corrected_data = ref_filter(radar, sweep, field="DBZ")

    # Convert the xarray Dataset to a DataTree and add it to the result_tree
    data_tree = xr.DataTree.from_dict(corrected_data.to_dict())

    # Copy the contents of data_tree into result_tree
    for key, value in data_tree.items():
        result_tree[key] = value
radar.sweep_6.corr_DBZ.plot(x="x", y="y", cmap="ChaseSpectral", vmin=-10, vmax=70)
<matplotlib.collections.QuadMesh at 0x72c1bc7d25d0>
Export#
Export to CfRadial1
xd.io.to_cfradial1(dtree=radar, filename="cfradial1_qced.nc", calibs=True)
?xd.io.to_cfradial1
Note#
If filename is None in the xd.io.to_cfradial1 function, it will automatically generate a
filename using the instrument name and the first available timestamp from the data.