ODIM_H5#
import xarray as xr
from open_radar_data import DATASETS

import xradar as xd
Download#
Fetching ODIM_H5 radar data file from open-radar-data repository.
filename = DATASETS.fetch("71_20181220_060628.pvol.h5")
xr.open_dataset#
Making use of the xarray odim backend. We also need to provide the group. We use CfRadial2 group access pattern.
ds = xr.open_dataset(filename, group="sweep_0", engine="odim")
display(ds)
<xarray.Dataset> Size: 40MB
Dimensions:            (azimuth: 360, range: 1200)
Coordinates:
  * azimuth            (azimuth) float32 1kB 0.5 1.5 2.5 ... 357.5 358.5 359.5
    elevation          (azimuth) float64 3kB ...
    time               (azimuth) datetime64[ns] 3kB ...
  * range              (range) float32 5kB 125.0 375.0 ... 2.996e+05 2.999e+05
    longitude          float64 8B ...
    latitude           float64 8B ...
    altitude           float64 8B ...
Data variables: (12/18)
    DBZH               (azimuth, range) float64 3MB ...
    DBZH_CLEAN         (azimuth, range) float64 3MB ...
    VRADDH             (azimuth, range) float64 3MB ...
    VRADH              (azimuth, range) float64 3MB ...
    WRADH              (azimuth, range) float64 3MB ...
    TH                 (azimuth, range) float64 3MB ...
    ...                 ...
    sweep_mode         <U20 80B ...
    sweep_number       int64 8B ...
    prt_mode           <U7 28B ...
    follow_mode        <U7 28B ...
    sweep_fixed_angle  float64 8B ...
    nyquist_velocity   float64 8B ...
Attributes:
Conventions: ODIM_H5/V2_2ds.sweep_fixed_angle.values
array(0.5)
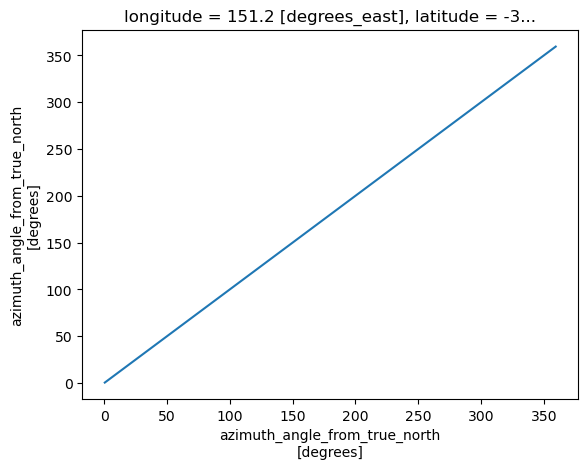
Plot Time vs. Azimuth#
ds.azimuth.plot()
[<matplotlib.lines.Line2D at 0x7b4474339a90>]
Plot Range vs. Time#
ds.DBZH.plot()
<matplotlib.collections.QuadMesh at 0x7b44743912b0>
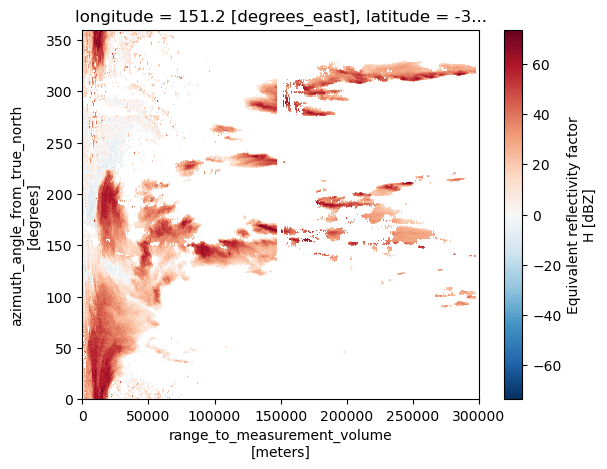
Plot Range vs. Azimuth#
We need to sort by azimuth and specify the y-coordinate.
ds.DBZH.sortby("azimuth").plot(y="azimuth")
<matplotlib.collections.QuadMesh at 0x7b446c04da90>
backend_kwargs#
Beside first_dim there are several additional backend_kwargs for the odim backend, which handle different aspects of angle alignment. This comes into play, when azimuth and/or elevation arrays are not evenly spacend and other issues.
?xd.io.OdimBackendEntrypoint
ds = xr.open_dataset(filename, group="sweep_0", engine="odim", first_dim="time")
display(ds)
<xarray.Dataset> Size: 40MB
Dimensions:            (time: 360, range: 1200)
Coordinates:
  * time               (time) datetime64[ns] 3kB 2018-12-20T06:06:28.04027776...
    elevation          (time) float64 3kB ...
    azimuth            (time) float32 1kB ...
  * range              (range) float32 5kB 125.0 375.0 ... 2.996e+05 2.999e+05
    longitude          float64 8B ...
    latitude           float64 8B ...
    altitude           float64 8B ...
Data variables: (12/18)
    DBZH               (time, range) float64 3MB ...
    DBZH_CLEAN         (time, range) float64 3MB ...
    VRADDH             (time, range) float64 3MB ...
    VRADH              (time, range) float64 3MB ...
    WRADH              (time, range) float64 3MB ...
    TH                 (time, range) float64 3MB ...
    ...                 ...
    sweep_mode         <U20 80B ...
    sweep_number       int64 8B ...
    prt_mode           <U7 28B ...
    follow_mode        <U7 28B ...
    sweep_fixed_angle  float64 8B ...
    nyquist_velocity   float64 8B ...
Attributes:
Conventions: ODIM_H5/V2_2open_odim_datatree#
The same works analoguous with the datatree loader. But additionally we can provide a sweep string, number or list.
?xd.io.open_odim_datatree
dtree = xd.io.open_odim_datatree(filename, sweep=8)
display(dtree)
<xarray.DataTree>
Group: /
│   Dimensions:              (sweep: 1)
│   Coordinates:
│       latitude             float64 8B ...
│       longitude            float64 8B ...
│       altitude             float64 8B ...
│   Dimensions without coordinates: sweep
│   Data variables:
│       volume_number        int64 8B 0
│       platform_type        <U5 20B 'fixed'
│       instrument_type      <U5 20B 'radar'
│       time_coverage_start  <U20 80B '2018-12-20T06:09:21Z'
│       time_coverage_end    <U20 80B '2018-12-20T06:09:34Z'
│       sweep_group_name     (sweep) int64 8B 8
│       sweep_fixed_angle    (sweep) float64 8B 7.4
│   Attributes:
│       Conventions:      ODIM_H5/V2_2
│       instrument_name:  None
│       version:          None
│       title:            None
│       institution:      None
│       references:       None
│       source:           None
│       history:          None
│       comment:          im/exported using xradar
└── Group: /sweep_0
        Dimensions:            (azimuth: 360, range: 590)
        Coordinates:
          * azimuth            (azimuth) float32 1kB 0.5 1.5 2.5 ... 357.5 358.5 359.5
            elevation          (azimuth) float64 3kB ...
            time               (azimuth) datetime64[ns] 3kB 2018-12-20T06:09:30.39167...
          * range              (range) float32 2kB 125.0 375.0 ... 1.471e+05 1.474e+05
        Data variables: (12/18)
            DBZH               (azimuth, range) float64 2MB ...
            DBZH_CLEAN         (azimuth, range) float64 2MB ...
            VRADDH             (azimuth, range) float64 2MB ...
            VRADH              (azimuth, range) float64 2MB ...
            WRADH              (azimuth, range) float64 2MB ...
            TH                 (azimuth, range) float64 2MB ...
            ...                 ...
            sweep_mode         <U20 80B ...
            sweep_number       int64 8B ...
            prt_mode           <U7 28B ...
            follow_mode        <U7 28B ...
            sweep_fixed_angle  float64 8B ...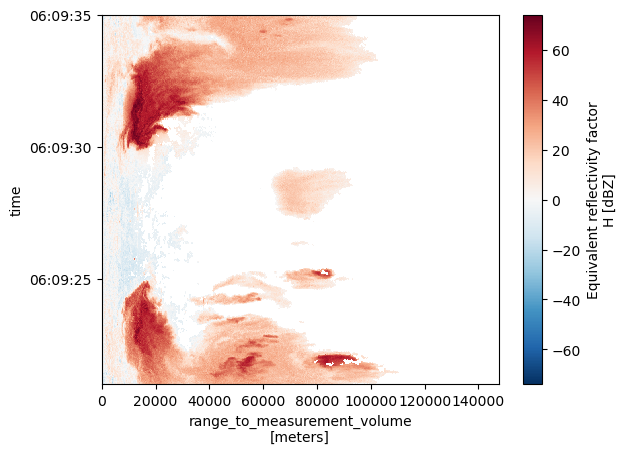
nyquist_velocity float64 8B ...Plot Sweep Range vs. Time#
dtree["sweep_0"].ds.DBZH.sortby("time").plot(y="time")
<matplotlib.collections.QuadMesh at 0x7b446bf3ee90>
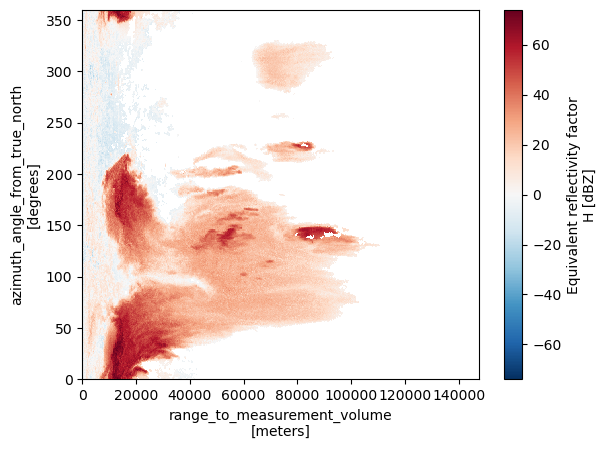
Plot Sweep Range vs. Azimuth#
dtree["sweep_0"].ds.DBZH.plot()
<matplotlib.collections.QuadMesh at 0x7b446be41d10>
dtree = xd.io.open_odim_datatree(filename, sweep="sweep_8")
display(dtree)
<xarray.DataTree>
Group: /
│   Dimensions:              (sweep: 1)
│   Coordinates:
│       latitude             float64 8B ...
│       longitude            float64 8B ...
│       altitude             float64 8B ...
│   Dimensions without coordinates: sweep
│   Data variables:
│       volume_number        int64 8B 0
│       platform_type        <U5 20B 'fixed'
│       instrument_type      <U5 20B 'radar'
│       time_coverage_start  <U20 80B '2018-12-20T06:09:21Z'
│       time_coverage_end    <U20 80B '2018-12-20T06:09:34Z'
│       sweep_group_name     (sweep) int64 8B 8
│       sweep_fixed_angle    (sweep) float64 8B 7.4
│   Attributes:
│       Conventions:      ODIM_H5/V2_2
│       instrument_name:  None
│       version:          None
│       title:            None
│       institution:      None
│       references:       None
│       source:           None
│       history:          None
│       comment:          im/exported using xradar
└── Group: /sweep_0
        Dimensions:            (azimuth: 360, range: 590)
        Coordinates:
          * azimuth            (azimuth) float32 1kB 0.5 1.5 2.5 ... 357.5 358.5 359.5
            elevation          (azimuth) float64 3kB ...
            time               (azimuth) datetime64[ns] 3kB 2018-12-20T06:09:30.39167...
          * range              (range) float32 2kB 125.0 375.0 ... 1.471e+05 1.474e+05
        Data variables: (12/18)
            DBZH               (azimuth, range) float64 2MB ...
            DBZH_CLEAN         (azimuth, range) float64 2MB ...
            VRADDH             (azimuth, range) float64 2MB ...
            VRADH              (azimuth, range) float64 2MB ...
            WRADH              (azimuth, range) float64 2MB ...
            TH                 (azimuth, range) float64 2MB ...
            ...                 ...
            sweep_mode         <U20 80B ...
            sweep_number       int64 8B ...
            prt_mode           <U7 28B ...
            follow_mode        <U7 28B ...
            sweep_fixed_angle  float64 8B ...
nyquist_velocity float64 8B ...dtree = xd.io.open_odim_datatree(filename, sweep=[0, 1, 8])
display(dtree)
<xarray.DataTree>
Group: /
│   Dimensions:              (sweep: 3)
│   Coordinates:
│       latitude             float64 8B ...
│       longitude            float64 8B ...
│       altitude             float64 8B ...
│   Dimensions without coordinates: sweep
│   Data variables:
│       volume_number        int64 8B 0
│       platform_type        <U5 20B 'fixed'
│       instrument_type      <U5 20B 'radar'
│       time_coverage_start  <U20 80B '2018-12-20T06:06:59Z'
│       time_coverage_end    <U20 80B '2018-12-20T06:09:48Z'
│       sweep_group_name     (sweep) int64 24B 1 2 9
│       sweep_fixed_angle    (sweep) float64 24B 0.9 1.3 10.0
│   Attributes:
│       Conventions:      ODIM_H5/V2_2
│       instrument_name:  None
│       version:          None
│       title:            None
│       institution:      None
│       references:       None
│       source:           None
│       history:          None
│       comment:          im/exported using xradar
├── Group: /sweep_0
│       Dimensions:            (azimuth: 360, range: 1200)
│       Coordinates:
│         * azimuth            (azimuth) float32 1kB 0.5 1.5 2.5 ... 357.5 358.5 359.5
│           elevation          (azimuth) float64 3kB ...
│           time               (azimuth) datetime64[ns] 3kB 2018-12-20T06:07:19.82358...
│         * range              (range) float32 5kB 125.0 375.0 ... 2.996e+05 2.999e+05
│       Data variables: (12/18)
│           DBZH               (azimuth, range) float64 3MB ...
│           DBZH_CLEAN         (azimuth, range) float64 3MB ...
│           VRADDH             (azimuth, range) float64 3MB ...
│           VRADH              (azimuth, range) float64 3MB ...
│           WRADH              (azimuth, range) float64 3MB ...
│           TH                 (azimuth, range) float64 3MB ...
│           ...                 ...
│           sweep_mode         <U20 80B ...
│           sweep_number       int64 8B ...
│           prt_mode           <U7 28B ...
│           follow_mode        <U7 28B ...
│           sweep_fixed_angle  float64 8B ...
│           nyquist_velocity   float64 8B ...
├── Group: /sweep_1
│       Dimensions:            (azimuth: 360, range: 1200)
│       Coordinates:
│         * azimuth            (azimuth) float32 1kB 0.5 1.5 2.5 ... 357.5 358.5 359.5
│           elevation          (azimuth) float64 3kB ...
│           time               (azimuth) datetime64[ns] 3kB 2018-12-20T06:07:42.68472...
│         * range              (range) float32 5kB 125.0 375.0 ... 2.996e+05 2.999e+05
│       Data variables: (12/18)
│           DBZH               (azimuth, range) float64 3MB ...
│           DBZH_CLEAN         (azimuth, range) float64 3MB ...
│           VRADDH             (azimuth, range) float64 3MB ...
│           VRADH              (azimuth, range) float64 3MB ...
│           WRADH              (azimuth, range) float64 3MB ...
│           TH                 (azimuth, range) float64 3MB ...
│           ...                 ...
│           sweep_mode         <U20 80B ...
│           sweep_number       int64 8B ...
│           prt_mode           <U7 28B ...
│           follow_mode        <U7 28B ...
│           sweep_fixed_angle  float64 8B ...
│           nyquist_velocity   float64 8B ...
└── Group: /sweep_2
        Dimensions:            (azimuth: 360, range: 480)
        Coordinates:
          * azimuth            (azimuth) float32 1kB 0.5 1.5 2.5 ... 357.5 358.5 359.5
            elevation          (azimuth) float64 3kB ...
            time               (azimuth) datetime64[ns] 3kB 2018-12-20T06:09:43.54582...
          * range              (range) float32 2kB 125.0 375.0 ... 1.196e+05 1.199e+05
        Data variables: (12/18)
            DBZH               (azimuth, range) float64 1MB ...
            DBZH_CLEAN         (azimuth, range) float64 1MB ...
            VRADDH             (azimuth, range) float64 1MB ...
            VRADH              (azimuth, range) float64 1MB ...
            WRADH              (azimuth, range) float64 1MB ...
            TH                 (azimuth, range) float64 1MB ...
            ...                 ...
            sweep_mode         <U20 80B ...
            sweep_number       int64 8B ...
            prt_mode           <U7 28B ...
            follow_mode        <U7 28B ...
            sweep_fixed_angle  float64 8B ...
nyquist_velocity float64 8B ...dtree = xd.io.open_odim_datatree(filename, sweep=["sweep_0", "sweep_1", "sweep_8"])
display(dtree)
<xarray.DataTree>
Group: /
│   Dimensions:              (sweep: 3)
│   Coordinates:
│       latitude             float64 8B ...
│       longitude            float64 8B ...
│       altitude             float64 8B ...
│   Dimensions without coordinates: sweep
│   Data variables:
│       volume_number        int64 8B 0
│       platform_type        <U5 20B 'fixed'
│       instrument_type      <U5 20B 'radar'
│       time_coverage_start  <U20 80B '2018-12-20T06:06:28Z'
│       time_coverage_end    <U20 80B '2018-12-20T06:09:34Z'
│       sweep_group_name     (sweep) int64 24B 0 1 8
│       sweep_fixed_angle    (sweep) float64 24B 0.5 0.9 7.4
│   Attributes:
│       Conventions:      ODIM_H5/V2_2
│       instrument_name:  None
│       version:          None
│       title:            None
│       institution:      None
│       references:       None
│       source:           None
│       history:          None
│       comment:          im/exported using xradar
├── Group: /sweep_0
│       Dimensions:            (azimuth: 360, range: 1200)
│       Coordinates:
│         * azimuth            (azimuth) float32 1kB 0.5 1.5 2.5 ... 357.5 358.5 359.5
│           elevation          (azimuth) float64 3kB ...
│           time               (azimuth) datetime64[ns] 3kB 2018-12-20T06:06:50.11246...
│         * range              (range) float32 5kB 125.0 375.0 ... 2.996e+05 2.999e+05
│       Data variables: (12/18)
│           DBZH               (azimuth, range) float64 3MB ...
│           DBZH_CLEAN         (azimuth, range) float64 3MB ...
│           VRADDH             (azimuth, range) float64 3MB ...
│           VRADH              (azimuth, range) float64 3MB ...
│           WRADH              (azimuth, range) float64 3MB ...
│           TH                 (azimuth, range) float64 3MB ...
│           ...                 ...
│           sweep_mode         <U20 80B ...
│           sweep_number       int64 8B ...
│           prt_mode           <U7 28B ...
│           follow_mode        <U7 28B ...
│           sweep_fixed_angle  float64 8B ...
│           nyquist_velocity   float64 8B ...
├── Group: /sweep_1
│       Dimensions:            (azimuth: 360, range: 1200)
│       Coordinates:
│         * azimuth            (azimuth) float32 1kB 0.5 1.5 2.5 ... 357.5 358.5 359.5
│           elevation          (azimuth) float64 3kB ...
│           time               (azimuth) datetime64[ns] 3kB 2018-12-20T06:07:19.82358...
│         * range              (range) float32 5kB 125.0 375.0 ... 2.996e+05 2.999e+05
│       Data variables: (12/18)
│           DBZH               (azimuth, range) float64 3MB ...
│           DBZH_CLEAN         (azimuth, range) float64 3MB ...
│           VRADDH             (azimuth, range) float64 3MB ...
│           VRADH              (azimuth, range) float64 3MB ...
│           WRADH              (azimuth, range) float64 3MB ...
│           TH                 (azimuth, range) float64 3MB ...
│           ...                 ...
│           sweep_mode         <U20 80B ...
│           sweep_number       int64 8B ...
│           prt_mode           <U7 28B ...
│           follow_mode        <U7 28B ...
│           sweep_fixed_angle  float64 8B ...
│           nyquist_velocity   float64 8B ...
└── Group: /sweep_2
        Dimensions:            (azimuth: 360, range: 590)
        Coordinates:
          * azimuth            (azimuth) float32 1kB 0.5 1.5 2.5 ... 357.5 358.5 359.5
            elevation          (azimuth) float64 3kB ...
            time               (azimuth) datetime64[ns] 3kB 2018-12-20T06:09:30.39167...
          * range              (range) float32 2kB 125.0 375.0 ... 1.471e+05 1.474e+05
        Data variables: (12/18)
            DBZH               (azimuth, range) float64 2MB ...
            DBZH_CLEAN         (azimuth, range) float64 2MB ...
            VRADDH             (azimuth, range) float64 2MB ...
            VRADH              (azimuth, range) float64 2MB ...
            WRADH              (azimuth, range) float64 2MB ...
            TH                 (azimuth, range) float64 2MB ...
            ...                 ...
            sweep_mode         <U20 80B ...
            sweep_number       int64 8B ...
            prt_mode           <U7 28B ...
            follow_mode        <U7 28B ...
            sweep_fixed_angle  float64 8B ...
            nyquist_velocity   float64 8B ...