Accessors#
To extend xarray.DataArray and xarray.Dataset
xradar aims to provide accessors which downstream libraries can hook into.
Those accessors are yet to be defined. For starters we could implement purpose-based
accessors (like .vis, .kdp or .trafo) on xarray.DataArray level.
To not have to import downstream packages a similar approach to xarray.backends using
importlib.metadata.entry_points could be facilitated.
In this notebook the creation of such an accessor is showcased.
import numpy as np
import xarray as xr
from open_radar_data import DATASETS

import xradar as xd
Import Data#
Fetch data from open-radar-data repository.
filename = DATASETS.fetch("71_20181220_060628.pvol.h5")
Downloading file '71_20181220_060628.pvol.h5' from 'https://github.com/openradar/open-radar-data/raw/main/data/71_20181220_060628.pvol.h5' to '/home/docs/.cache/open-radar-data'.
Open data#
ds = xr.open_dataset(filename, group="sweep_0", engine="odim")
display(ds.DBZH.values)
array([[ nan,  0. , 13. , ...,  nan,  nan,  nan],
       [ nan,  1.5, 13.5, ...,  nan,  nan,  nan],
       [ nan,  1.5, 11.5, ...,  nan,  nan,  nan],
       ...,
       [ nan,  1.5, 11.5, ...,  nan,  nan,  nan],
       [ nan,  1.5,  6. , ...,  nan,  nan,  nan],
       [ nan,  6. , 12.5, ...,  nan,  nan,  nan]], shape=(360, 1200))
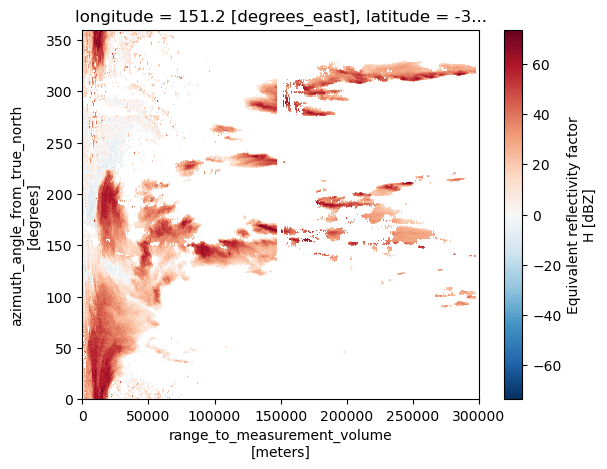
Plot DBZH#
ds.DBZH.plot()
Matplotlib is building the font cache; this may take a moment.
<matplotlib.collections.QuadMesh at 0x7425cf9d2e40>
Define two example functions#
Functions copied verbatim from wradlib.
def _decibel(x):
    """Calculates the decibel representation of the input values

    :math:`dBZ=10 \\cdot \\log_{10} z`

    Parameters
    ----------
    x : float or :class:`numpy:numpy.ndarray`
        (must not be <= 0.)

    Examples
    --------
    >>> from wradlib.trafo import decibel
    >>> print(decibel(100.))
    20.0
    """
    return 10.0 * np.log10(x)


def _idecibel(x):
    """Calculates the inverse of input decibel values

    :math:`z=10^{x \\over 10}`

    Parameters
    ----------
    x : float or :class:`numpy:numpy.ndarray`

    Examples
    --------
    >>> from wradlib.trafo import idecibel
    >>> print(idecibel(10.))
    10.0

    """
    return 10.0 ** (x / 10.0)
Function dictionaries#
To show the import of the functions, we put them in different dictionaries as we would get them via entry_points.
This is what the downstream libraries would have to provide.
package_1_func = {"trafo": {"decibel": _decibel}}
package_2_func = {"trafo": {"idecibel": _idecibel}}
xradar internal functionality#
This is how xradar would need to treat that input data.
downstream_functions = [package_1_func, package_2_func]
xradar_accessors = ["trafo"]
package_functions = {}
for accessor in xradar_accessors:
    package_functions[accessor] = {}
    for dfuncs in downstream_functions:
        package_functions[accessor].update(dfuncs[accessor])
print(package_functions)
{'trafo': {'decibel': <function _decibel at 0x7425cf544220>, 'idecibel': <function _idecibel at 0x7425cf5442c0>}}
Create and register accessor#
We bundle the different steps into one function, create_xradar_dataarray_accessor.
for accessor in xradar_accessors:
    xd.accessors.create_xradar_dataarray_accessor(accessor, package_functions[accessor])
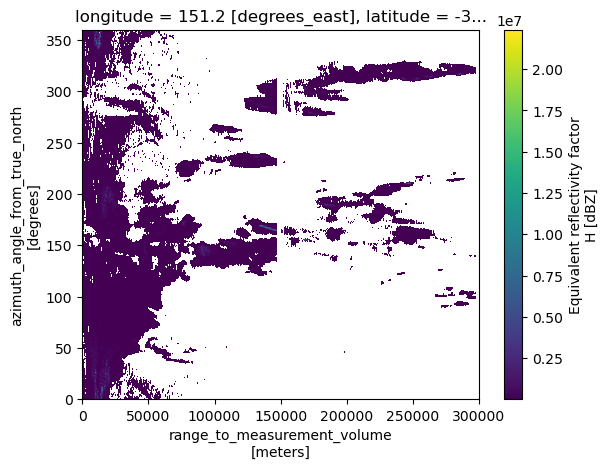
Convert DBZH to linear and plot#
z = ds.DBZH.trafo.idecibel()
z.plot()
<matplotlib.collections.QuadMesh at 0x7425cf552d50>
Convert z to decibel and plot()#
dbz = z.trafo.decibel()
display(dbz)
<xarray.DataArray 'DBZH' (azimuth: 360, range: 1200)> Size: 3MB
array([[ nan,  0. , 13. , ...,  nan,  nan,  nan],
       [ nan,  1.5, 13.5, ...,  nan,  nan,  nan],
       [ nan,  1.5, 11.5, ...,  nan,  nan,  nan],
       ...,
       [ nan,  1.5, 11.5, ...,  nan,  nan,  nan],
       [ nan,  1.5,  6. , ...,  nan,  nan,  nan],
       [ nan,  6. , 12.5, ...,  nan,  nan,  nan]], shape=(360, 1200))
Coordinates:
  * azimuth    (azimuth) float32 1kB 0.5 1.5 2.5 3.5 ... 356.5 357.5 358.5 359.5
    elevation  (azimuth) float64 3kB ...
    time       (azimuth) datetime64[ns] 3kB ...
  * range      (range) float32 5kB 125.0 375.0 625.0 ... 2.996e+05 2.999e+05
    longitude  float64 8B ...
    latitude   float64 8B ...
    altitude   float64 8B ...
Attributes:
    _Undetect:      0.0
    long_name:      Equivalent reflectivity factor H
    units:          dBZ
standard_name: radar_equivalent_reflectivity_factor_hdbz.plot()
<matplotlib.collections.QuadMesh at 0x7425cdc451d0>