Furuno#
import xarray as xr
from open_radar_data import DATASETS

import xradar as xd
Download#
Fetching Furuno radar data file from open-radar-data repository.
filename_scnx = DATASETS.fetch("2006_20220324_000000_000.scnx.gz")
filename_scn = DATASETS.fetch("0080_20210730_160000_01_02.scn.gz")
Downloading file '2006_20220324_000000_000.scnx.gz' from 'https://github.com/openradar/open-radar-data/raw/main/data/2006_20220324_000000_000.scnx.gz' to '/home/docs/.cache/open-radar-data'.
Downloading file '0080_20210730_160000_01_02.scn.gz' from 'https://github.com/openradar/open-radar-data/raw/main/data/0080_20210730_160000_01_02.scn.gz' to '/home/docs/.cache/open-radar-data'.
xr.open_dataset#
Making use of the xarray furuno backend.
scn format#
ds = xr.open_dataset(filename_scn, engine="furuno")
display(ds)
<xarray.Dataset> Size: 55MB
Dimensions:            (azimuth: 1376, range: 602)
Coordinates:
  * azimuth            (azimuth) float64 11kB 0.21 0.47 0.74 ... 359.7 359.9
    elevation          (azimuth) float64 11kB ...
    time               (azimuth) datetime64[ns] 11kB ...
  * range              (range) float32 2kB 25.0 75.0 ... 3.002e+04 3.008e+04
    longitude          float64 8B ...
    latitude           float64 8B ...
    altitude           float64 8B ...
Data variables: (12/14)
    RATE               (azimuth, range) float64 7MB ...
    DBZH               (azimuth, range) float64 7MB ...
    VRADH              (azimuth, range) float64 7MB ...
    ZDR                (azimuth, range) float64 7MB ...
    KDP                (azimuth, range) float64 7MB ...
    PHIDP              (azimuth, range) float64 7MB ...
    ...                 ...
    QUAL               (azimuth, range) uint16 2MB ...
    sweep_mode         <U20 80B ...
    sweep_number       int64 8B ...
    prt_mode           <U7 28B ...
    follow_mode        <U7 28B ...
    sweep_fixed_angle  float64 8B ...
Attributes:
    source:            Furuno
    version:           3
    radar_constant_h:  9.575470000000001e-17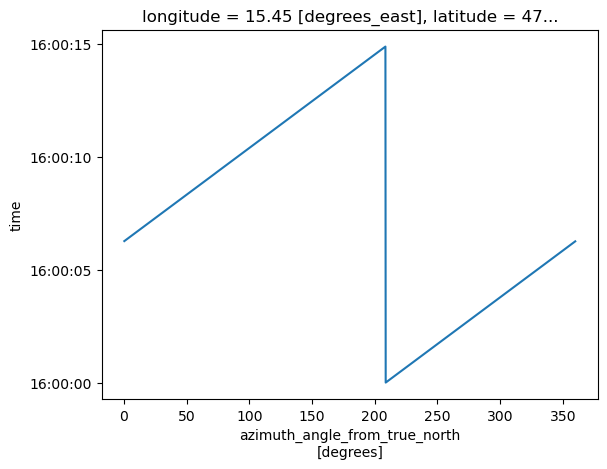
radar_constant_v: 9.144499999999999e-17Plot Time vs. Azimuth#
ds.azimuth.plot(y="time")
[<matplotlib.lines.Line2D at 0x7982172f6350>]
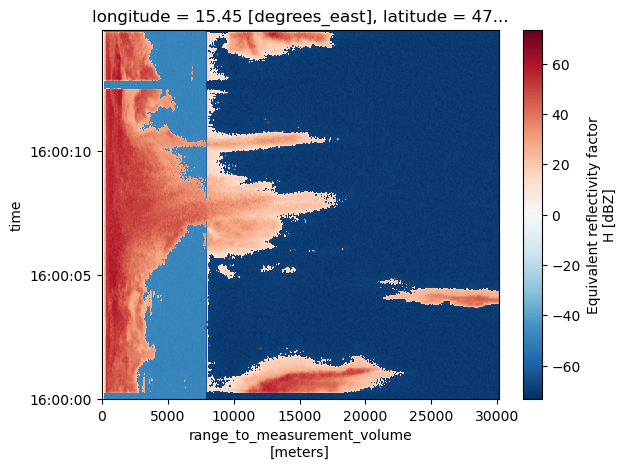
Plot Range vs. Time#
We need to sort by time and specify the y-coordinate.
ds.DBZH.sortby("time").plot(y="time")
<matplotlib.collections.QuadMesh at 0x7982171a2510>
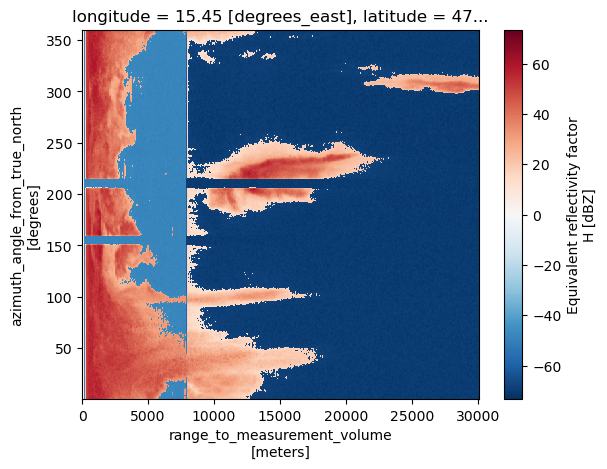
Plot Range vs. Azimuth#
ds.DBZH.sortby("azimuth").plot(y="azimuth")
<matplotlib.collections.QuadMesh at 0x79820de10e10>
scnx format#
ds = xr.open_dataset(filename_scnx, engine="furuno")
display(ds)
<xarray.Dataset> Size: 45MB
Dimensions:            (azimuth: 722, range: 936)
Coordinates:
  * azimuth            (azimuth) float64 6kB 0.19 0.68 1.16 ... 359.2 359.7
    elevation          (azimuth) float64 6kB ...
    time               (azimuth) datetime64[ns] 6kB ...
  * range              (range) float32 4kB 37.5 112.5 ... 7.009e+04 7.016e+04
    longitude          float64 8B ...
    latitude           float64 8B ...
    altitude           float64 8B ...
Data variables: (12/14)
    RATE               (azimuth, range) float64 5MB ...
    DBZH               (azimuth, range) float64 5MB ...
    VRADH              (azimuth, range) float64 5MB ...
    ZDR                (azimuth, range) float64 5MB ...
    KDP                (azimuth, range) float64 5MB ...
    PHIDP              (azimuth, range) float64 5MB ...
    ...                 ...
    QUAL               (azimuth, range) uint16 1MB ...
    sweep_mode         <U20 80B ...
    sweep_number       int64 8B ...
    prt_mode           <U7 28B ...
    follow_mode        <U7 28B ...
    sweep_fixed_angle  float64 8B ...
Attributes:
    source:                     Furuno
    version:                    10
    antenna_gain_h:             337
    antenna_gain_v:             338
    tx_power_h:                 724
    tx_power_v:                 708
    radar_constant_h:           -1294
    radar_constant_v:           -1296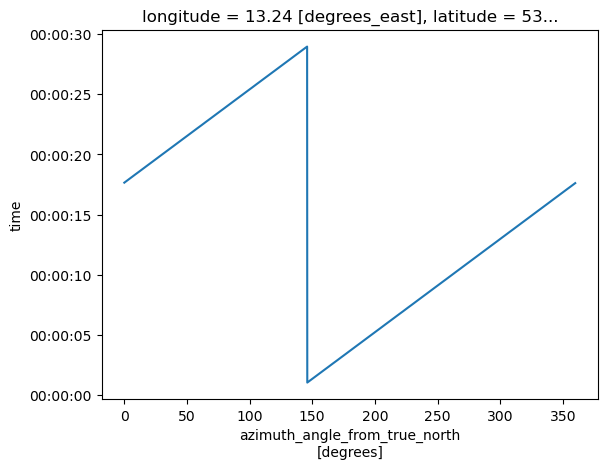
noise_power_short_pulse_h: -604Plot Time vs. Azimuth#
ds.azimuth.plot(y="time")
[<matplotlib.lines.Line2D at 0x79820def2e90>]
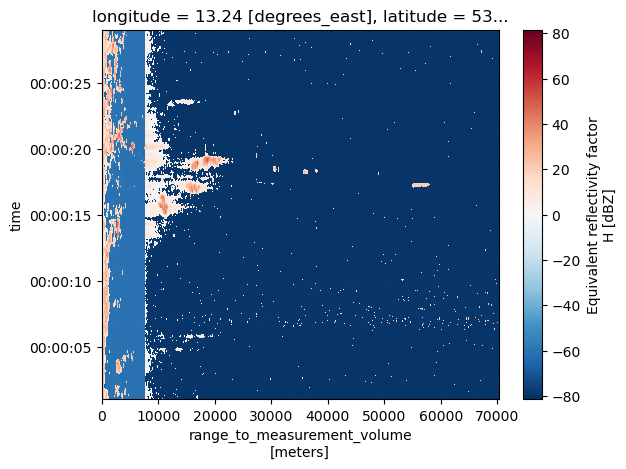
Plot Range vs. Time#
We need to sort by time and specify the y-coordinate.
ds.DBZH.sortby("time").plot(y="time")
<matplotlib.collections.QuadMesh at 0x798219945450>
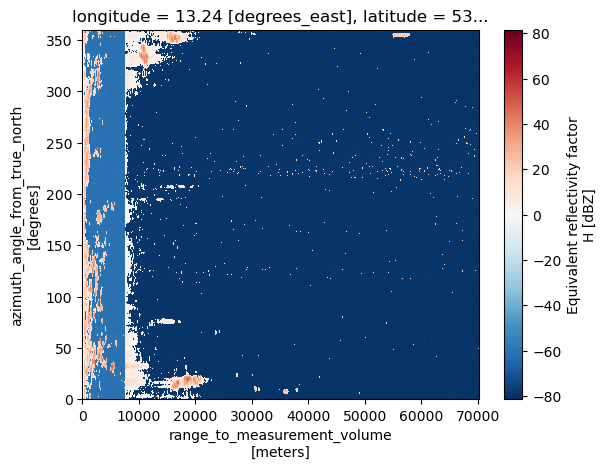
Plot Range vs. Azimuth#
ds.DBZH.sortby("azimuth").plot(y="azimuth")
<matplotlib.collections.QuadMesh at 0x79821980a710>
open_furuno_datatree#
Furuno scn/scnx files consist only of one sweep. But we might load and combine several sweeps into one DataTree.
dtree = xd.io.open_furuno_datatree(filename_scn)
display(dtree)
<xarray.DataTree>
Group: /
│   Dimensions:              (sweep: 1)
│   Coordinates:
│       longitude            float64 8B 15.45
│       altitude             float64 8B 407.9
│       latitude             float64 8B 47.08
│   Dimensions without coordinates: sweep
│   Data variables:
│       volume_number        int64 8B 0
│       platform_type        <U5 20B 'fixed'
│       instrument_type      <U5 20B 'radar'
│       time_coverage_start  <U20 80B '2021-07-30T16:00:00Z'
│       time_coverage_end    <U20 80B '2021-07-30T16:00:14Z'
│       sweep_fixed_angle    (sweep) float64 8B 7.8
│       sweep_group_name     (sweep) int64 8B 0
│   Attributes:
│       Conventions:      None
│       instrument_name:  None
│       version:          3
│       title:            None
│       institution:      None
│       references:       None
│       source:           Furuno
│       history:          None
│       comment:          im/exported using xradar
└── Group: /sweep_0
        Dimensions:            (azimuth: 1376, range: 602)
        Coordinates:
          * azimuth            (azimuth) float64 11kB 0.21 0.47 0.74 ... 359.7 359.9
            elevation          (azimuth) float64 11kB ...
            time               (azimuth) datetime64[ns] 11kB 2021-07-30T16:00:06.2777...
          * range              (range) float32 2kB 25.0 75.0 ... 3.002e+04 3.008e+04
        Data variables: (12/14)
            RATE               (azimuth, range) float64 7MB ...
            DBZH               (azimuth, range) float64 7MB ...
            VRADH              (azimuth, range) float64 7MB ...
            ZDR                (azimuth, range) float64 7MB ...
            KDP                (azimuth, range) float64 7MB ...
            PHIDP              (azimuth, range) float64 7MB ...
            ...                 ...
            QUAL               (azimuth, range) uint16 2MB ...
            sweep_mode         <U20 80B ...
            sweep_number       int64 8B ...
            prt_mode           <U7 28B ...
            follow_mode        <U7 28B ...
sweep_fixed_angle float64 8B ...Plot Sweep Range vs. Time#
dtree["sweep_0"].ds.DBZH.plot()
<matplotlib.collections.QuadMesh at 0x798219709d10>
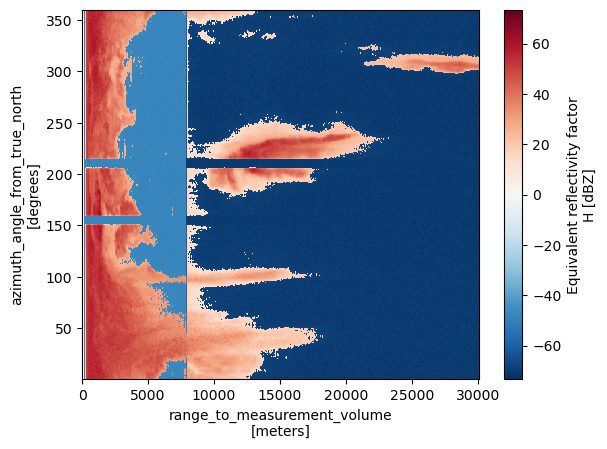
Plot Sweep Range vs. Azimuth#
dtree["sweep_0"].ds.DBZH.sortby("azimuth").plot(y="azimuth")
<matplotlib.collections.QuadMesh at 0x7982197c3610>