Assign GeoCoords#
This notebook demonstrates how to work with geocoordinates (longitude and latitude) instead of radar-centric x and y coordinates.
import cmweather  # noqa: F401
import matplotlib.pyplot as plt
import xarray as xr
from open_radar_data import DATASETS

import xradar as xd
Define Functions#
def get_geocoords(ds):
    """
    Converts Cartesian coordinates (x, y, z) in a radar dataset to geographic
    coordinates (longitude, latitude, altitude) using CRS transformation.

    Parameters
    ----------
    ds : xarray.Dataset
        Radar dataset with Cartesian coordinates.

    Returns
    -------
    xarray.Dataset
        Dataset with added 'lon', 'lat', and 'alt' coordinates and their attributes.
    """
    from pyproj import CRS, Transformer

    # Convert the dataset to georeferenced coordinates
    ds = ds.xradar.georeference()
    # Define source and target coordinate reference systems (CRS)
    src_crs = ds.xradar.get_crs()
    trg_crs = CRS.from_user_input(4326)  # EPSG:4326 (WGS 84)
    # Create a transformer for coordinate conversion
    transformer = Transformer.from_crs(src_crs, trg_crs)
    # Transform x, y, z coordinates to latitude, longitude, and altitude
    trg_y, trg_x, trg_z = transformer.transform(ds.x, ds.y, ds.z)
    # Assign new coordinates with appropriate attributes
    ds = ds.assign_coords(
        {
            "lon": (ds.x.dims, trg_x, xd.model.get_longitude_attrs()),
            "lat": (ds.y.dims, trg_y, xd.model.get_latitude_attrs()),
            "alt": (ds.z.dims, trg_z, xd.model.get_altitude_attrs()),
        }
    )
    return ds


def fix_sitecoords(ds):
    coords = ["longitude", "latitude", "altitude", "altitude_agl"]
    for coord in coords:
        if coord not in ds:
            continue
        # Skip coords that are already scalar
        if ds[coord].ndim == 0:
            continue
        # Compute median excluding NaN
        data = ds[coord].median(skipna=True).item()
        attrs = ds[coord].attrs
        ds = ds.assign_coords({coord: xr.DataArray(data=data, attrs=attrs)})
    return ds
Load Data#
file1 = DATASETS.fetch("cfrad.20080604_002217_000_SPOL_v36_SUR.nc")
file2 = DATASETS.fetch("cfrad.20211011_201557.188_to_20211011_201617.720_DOW8_PPI.nc")
Downloading file 'cfrad.20080604_002217_000_SPOL_v36_SUR.nc' from 'https://github.com/openradar/open-radar-data/raw/main/data/cfrad.20080604_002217_000_SPOL_v36_SUR.nc' to '/home/docs/.cache/open-radar-data'.
Downloading file 'cfrad.20211011_201557.188_to_20211011_201617.720_DOW8_PPI.nc' from 'https://github.com/openradar/open-radar-data/raw/main/data/cfrad.20211011_201557.188_to_20211011_201617.720_DOW8_PPI.nc' to '/home/docs/.cache/open-radar-data'.
Example #1#
Note: Station coordinates (latitude, longitude, altitude) are stored on the root node of the DataTree. When accessing a sweep dataset directly, use .to_dataset(inherit="all_coords") to inherit these coordinates from the root. The .xradar.georeference() accessor handles this automatically.
dtree1 = xd.io.open_cfradial1_datatree(file1)
dtree1 = dtree1.xradar.georeference()
display(dtree1["sweep_0"].ds)
<xarray.DatasetView> Size: 15MB
Dimensions:                    (azimuth: 483, range: 996)
Coordinates:
  * azimuth                    (azimuth) float32 2kB 0.0 0.75 ... 358.5 359.2
    elevation                  (azimuth) float32 2kB 0.5164 0.5219 ... 0.5219
    time                       (azimuth) datetime64[ns] 4kB 2008-06-04T00:15:...
  * range                      (range) float32 4kB 150.0 300.0 ... 1.494e+05
    x                          (azimuth, range) float64 4MB 0.0 ... -1.955e+03
    y                          (azimuth, range) float64 4MB 150.0 ... 1.493e+05
    z                          (azimuth, range) float64 4MB 46.35 ... 2.718e+03
    latitude                   float64 8B 22.53
    longitude                  float64 8B 120.4
    altitude                   float64 8B 45.0
    crs_wkt                    int64 8B 0
Data variables: (12/18)
    sweep_number               int32 4B ...
    sweep_mode                 <U20 80B 'azimuth_surveillance'
    prt_mode                   |S32 32B ...
    follow_mode                |S32 32B ...
    sweep_fixed_angle          float32 4B ...
    pulse_width                (azimuth) float32 2kB ...
    ...                         ...
    r_calib_index              (azimuth) int8 483B ...
    measured_transmit_power_h  (azimuth) float32 2kB ...
    measured_transmit_power_v  (azimuth) float32 2kB ...
    scan_rate                  (azimuth) float32 2kB ...
    DBZ                        (azimuth, range) float32 2MB ...
VR (azimuth, range) float32 2MB ...Assign lat, lon, and alt#
dtree1 = dtree1.xradar.map_over_sweeps(get_geocoords)
display(dtree1["sweep_0"].ds)
<xarray.DatasetView> Size: 27MB
Dimensions:                    (azimuth: 483, range: 996)
Coordinates: (12/14)
  * azimuth                    (azimuth) float32 2kB 0.0 0.75 ... 358.5 359.2
    elevation                  (azimuth) float32 2kB 0.5164 0.5219 ... 0.5219
    time                       (azimuth) datetime64[ns] 4kB 2008-06-04T00:15:...
  * range                      (range) float32 4kB 150.0 300.0 ... 1.494e+05
    x                          (azimuth, range) float64 4MB 0.0 ... -1.955e+03
    y                          (azimuth, range) float64 4MB 150.0 ... 1.493e+05
    ...                         ...
    lat                        (azimuth, range) float64 4MB 22.53 ... 23.88
    alt                        (azimuth, range) float64 4MB 46.35 ... 2.718e+03
    latitude                   float64 8B 22.53
    longitude                  float64 8B 120.4
    altitude                   float64 8B 45.0
    crs_wkt                    int64 8B 0
Data variables: (12/18)
    sweep_number               int32 4B ...
    sweep_mode                 <U20 80B 'azimuth_surveillance'
    prt_mode                   |S32 32B ...
    follow_mode                |S32 32B ...
    sweep_fixed_angle          float32 4B ...
    pulse_width                (azimuth) float32 2kB ...
    ...                         ...
    r_calib_index              (azimuth) int8 483B ...
    measured_transmit_power_h  (azimuth) float32 2kB ...
    measured_transmit_power_v  (azimuth) float32 2kB ...
    scan_rate                  (azimuth) float32 2kB ...
    DBZ                        (azimuth, range) float32 2MB ...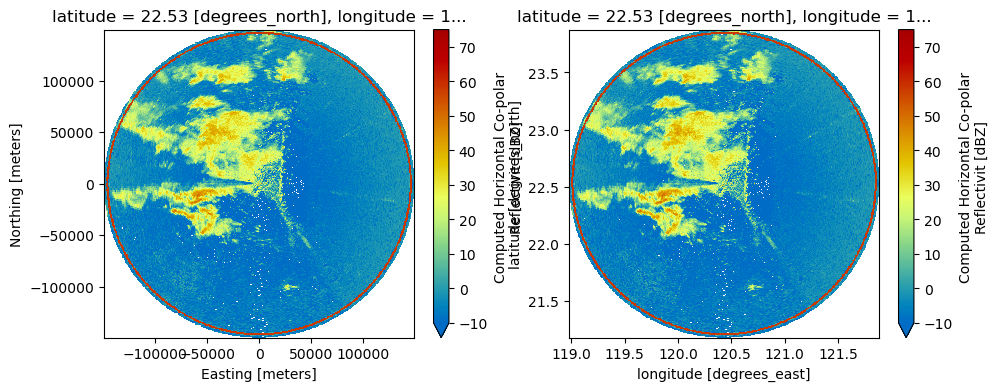
VR (azimuth, range) float32 2MB ...ds = dtree1["sweep_0"].to_dataset()
fig, ax = plt.subplots(1, 2, figsize=(11, 4))
ds["DBZ"].plot(x="x", y="y", vmin=-10, vmax=75, cmap="HomeyerRainbow", ax=ax[0])

ds["DBZ"].plot(x="lon", y="lat", vmin=-10, vmax=75, cmap="HomeyerRainbow", ax=ax[1])
plt.show()
Example #2#
dtree2 = xd.io.open_cfradial1_datatree(file2)
try:
    dtree2 = dtree2.xradar.georeference()
except Exception:
    print("Georeferencing failed!")
Georeferencing failed!
ds2 = dtree2["sweep_0"].to_dataset(inherit="all_coords")
print("Longitude", ds2["longitude"].shape)
print("Latitude", ds2["latitude"].shape)
Longitude (731,)
Latitude (731,)
Important Note:
This radar data is from a mobile research radar called Doppler on Wheels (DOW). In previous versions of xradar,
site coordinates (latitude, longitude) were stored per-ray on each sweep, resulting in shape (731,).
Now, station coordinates are stored as scalar values on the root node of the DataTree and inherited by sweeps
via to_dataset(inherit="all_coords"). The fix_sitecoords helper gracefully handles both
cases — it skips coordinates that are already scalar.
Fix Coords#
# Fix per-ray station coords on the root node by taking the median.
# Mobile radars like DOW have per-ray lat/lon which must be collapsed
# to scalar values before georeferencing.
root_ds = dtree2.ds
for coord in ["longitude", "latitude", "altitude"]:
    if coord in root_ds.coords and root_ds[coord].ndim > 0:
        median_val = root_ds[coord].median(skipna=True).item()
        root_ds = root_ds.assign_coords({coord: median_val})
dtree2.ds = root_ds
dtree2 = dtree2.xradar.map_over_sweeps(get_geocoords)
display(dtree2["sweep_0"].ds)
<xarray.DatasetView> Size: 116MB
Dimensions:                    (azimuth: 731, range: 1984, frequency: 1)
Coordinates: (12/15)
  * azimuth                    (azimuth) float32 3kB 0.0 0.5 1.0 ... 359.0 359.5
    elevation                  (azimuth) float32 3kB 0.4395 0.4395 ... 0.4395
    time                       (azimuth) datetime64[ns] 6kB 2021-10-11T20:15:...
  * range                      (range) float32 8kB 37.47 112.4 ... 1.487e+05
    x                          (azimuth, range) float64 12MB 0.0 ... -1.297e+03
    y                          (azimuth, range) float64 12MB 37.47 ... 1.486e+05
    ...                         ...
    alt                        (azimuth, range) float64 12MB 211.3 ... 2.652e+03
  * frequency                  (frequency) float32 4B 9.45e+09
    latitude                   float64 8B 40.01
    longitude                  float64 8B -88.33
    altitude                   float64 8B 211.0
    crs_wkt                    int64 8B 0
Data variables: (12/31)
    sweep_number               float64 8B ...
    sweep_mode                 <U6 24B 'sector'
    prt_mode                   |S32 32B ...
    follow_mode                |S32 32B ...
    sweep_fixed_angle          float32 4B ...
    ray_start_range            (azimuth) float32 3kB ...
    ...                         ...
    DBMHC                      (azimuth, range) float32 6MB ...
    DBZHC                      (azimuth, range) float32 6MB ...
    VEL                        (azimuth, range) float32 6MB ...
    VS1                        (azimuth, range) float32 6MB ...
    VL1                        (azimuth, range) float32 6MB ...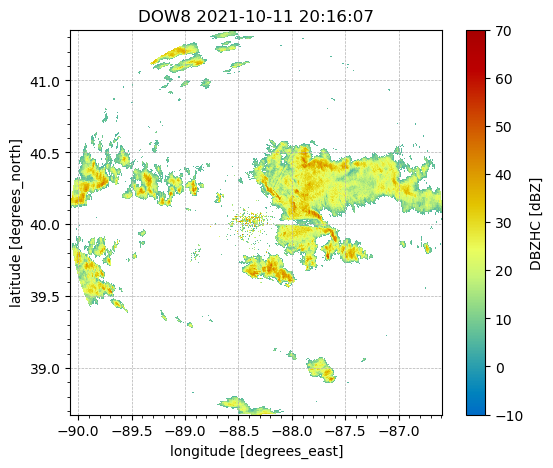
WIDTH (azimuth, range) float32 6MB ...ds = dtree2["sweep_0"].to_dataset()
ref = ds.where(ds.DBZHC >= 5)["DBZHC"]
fig = plt.figure(figsize=(6, 5))
ax = plt.axes()
pl = ref.plot(
x="lon",
y="lat",
vmin=-10,
vmax=70,
cmap="HomeyerRainbow",
ax=ax,
)
ax.minorticks_on()
ax.grid(ls="--", lw=0.5)
ax.set_aspect("auto")
title = (
dtree2.attrs["instrument_name"]
+ " "
+ str(ds.time.mean().dt.strftime("%Y-%m-%d %H:%M:%S").values)
)
ax.set_title(title)
plt.show()